Quantcast
Channel: Palo Alto Networks – Weberblog.net
Viewing all 88 articles
Browse latest View live

PAN Blocking Details

$
0
0

One of my readers sent me this question:

We have an internal discussion about whether it is possible to block the 3 way hanshake TCP but allow the JDBC application protocol. In other words we would like to block the test of the port with the command “telent address port” but we would like that the connections via JDBC continue to work. is it possible to do this theoretically? Is it possibile to do it with paloalto firewall?

Let’s have a look:

Some more details from the reader’s mail:

Please note: when I say blocking, I mean “connection refused” or “timeout” (so interrupt the 3 way handshake) I don’t intend to terminate the connection immediately

we want that:
telnet x.x.x.x y
Trying x.x.x.x…
telnet: Unable to connect to remote host: Connection refused

or that
telnet x.x.x.x y
Trying x.x.x.x…
telnet: Unable to connect to remote host: Connection timed out

but i want that the application protocol works fine?
Is it possibile whith Palo Altro Firewall? Or Palo Alto Firewall can only drop the connection after the 3 way hanshake like this:

telnet x.x.x.x y
Trying x.x.x.x…
Connected to x.x.x.x.
Escape character is ‘^]’.
Connection closed by foreign host.

I ask that because I inspected (with tcpdump) the packet of telnet command, it perform only 3 way hanshake then print to console:
Connected to x.x.x.x.
Escape character is ‘^]’.

So I think that a Palo Alto firewall cannot prevent the client from establishing the connection, but he can recognize that only after 3 way hanshake so only after TCP connection was established.

Basically, the reader is correct: The Palo Alto Networks firewall can’t prevent the client from establishing the basic telnet connection if there’s a matching allow policy in place. In other words: If the application shall work, the port has to be open and can be tested with telnet. However, if your policy allows only one certain application, you won’t be able to use this telnet session for everything. At some point, Palo Alto will recognize that your telnet-test is NOT the allowed application and will reset/block the connection.

How security policies from Palo Alto Networks work

  • Either you’re using a destination TCP/UDP port-based rule, called “Service” in the PAN language. This allows/denies connections solely based on their port. (Commonly only the destination port is used for this.) Allowing port 80 will allow *anything* over this port, such as basic HTTP, Telnet, SSH, TLS, SMTP, whatever. This is the old school way of port-based firewalls and not recommended anymore.
    Port-based rule.

    (Of course, the destination server must listen on this port and reply to your source IP address. In the case of TCP the full three-way handshake of SYN, SYN-ACK, ACK takes place, before any data is transferred.)

  • Or you’re using an application-based rule, with or without a more restricted service of “application-default”, “any”, or “select …”. For example, you’re allowing the application “smtp” with a service of “application-default”, i.e., TCP port 25. Now, the client’s very first “SYN, SYN-ACK, ACK” will always be allowed (!) independent of the application. This is probably weird for many admins. It can be a valid mail transfer or just a telnet-test. BUT: Immediately after the first data packets traverse the firewall, it recognizes the upper-layer application (such as smtp or http or ms-rdp) and will block the session if it’s not smtp.
    Application-based rule.
  • In any case: As long as the port is allowed (either through a port-based rule or an application-based rule with any kind of service), the three-way TCP handshake will succeed! You will always be able to telnet to the destination service. But you won’t be able to do something different than the allowed application, as long as you’re using an application-based rule.
If the application on port X shall work, your telnet-test on this port X will succeed at a first glance, since it is too early for a firewall to detect the application as long as there is no data flowing through the device.

That is: Your clients/users will always be able to check whether the destination server and port is up and running. But they will be blocked immediately if they do something different than the allowed application.

What Palo Alto can do to block unwanted connections

  • Use more specific source/destination IP addresses in your policies. Only valid clients should access the needed servers.
  • Only allow needed applications with its “application-default” destination ports. In the case of the “any” selection, *every* TCP/UDP connection will be allowed at a first glance, till the real application is detected. (Again: this might be weird! Have a look at this post: Palo Alto Application: First Packets Will Pass!)
  • Use User-IDs to allow only connections from declared users. This is a great feature that distinguishes between the mere IP address of a terminal server (for example), and the different users that are using this single machine.

Featured image “‘U gotta ticket ?’” by CJS*64 is licensed under CC BY-NC-ND 2.0.


Workaround for Not Using a Palo Alto with a 6in4 Tunnel

$
0
0

Of course, you should use dual-stack networks for almost everything on the Internet. Or even better: IPv6-only with DNS64/NAT64 and so on. ;) Unfortunately, still not every site has native IPv6 support. However, we can simply use the IPv6 Tunnel Broker from Hurricane Electric to overcome this time-based issue.

Well, wait… Not when using a Palo Alto Networks firewall which lacks 6in4 tunnel support. Sigh. Here’s my workaround:

Note that this post is one of many related to IPv6. Click here for a structured list.

Please note that my approach only works when you have at least 2x public IPv4 addresses. This might not be the case on almost all residential ISP connections. :( Since I am using the Palo in my lab which has a couple of public legacy IP addresses, it works quite good. Here is the idea:

  • Using a Cisco router for doing the 6in4 tunnel to HE.
  • Using 2x “untrust” interfaces on the Palo, one for legacy IP to the Internet, one for IPv6 to the Cisco router. I am using the first routed /64 from HE for this transfer segment between the Palo and the router, while I am routing the other /48 to the Palo. (Note that you get at least 1x /64 and 1x /48 from HE.)
  • Since both interfaces are within the same “untrust” zone, your policies are as normal. You don’t have to distinguish between the outgoing interface nor the Internet Protocol. After all!

Here’s a rough sketch:

Cisco Router with 6in4

This is my Cisco router config. I am using a Cisco 2811 (revision 3.0), IOS version 15.1(4)M12a. Probably nothing new for you. Default IPv4 route to the ISP, default IPv6 route into the tunnel, another /48 route to the Palo Alto:

interface Tunnel0
 description Hurricane Electric IPv6 Tunnel Broker
 no ip address
 ipv6 address 2001:470:1F0A:101A::2/64
 ipv6 enable
 tunnel source 193.24.227.12
 tunnel mode ipv6ip
 tunnel destination 216.66.80.30
!
interface FastEthernet0/0
 description ISP
 ip address 193.24.227.12 255.255.255.224
!
interface FastEthernet0/1
 description PA-220-eth1/1
 no ip address
 ipv6 address 2001:470:1F0B:1024::1/64
 ipv6 enable
!
ip route 0.0.0.0 0.0.0.0 FastEthernet0/0 193.24.227.1
!
ipv6 route 2001:470:765B::/48 FastEthernet0/1 2001:470:1F0B:1024::2
ipv6 route ::/0 Tunnel0

Show of routes:

router1#show ip route
Codes: L - local, C - connected, S - static, R - RIP, M - mobile, B - BGP
       D - EIGRP, EX - EIGRP external, O - OSPF, IA - OSPF inter area
       N1 - OSPF NSSA external type 1, N2 - OSPF NSSA external type 2
       E1 - OSPF external type 1, E2 - OSPF external type 2
       i - IS-IS, su - IS-IS summary, L1 - IS-IS level-1, L2 - IS-IS level-2
       ia - IS-IS inter area, * - candidate default, U - per-user static route
       o - ODR, P - periodic downloaded static route, H - NHRP, l - LISP
       + - replicated route, % - next hop override

Gateway of last resort is 193.24.227.1 to network 0.0.0.0

S*    0.0.0.0/0 [1/0] via 193.24.227.1, FastEthernet0/0
      193.24.227.0/24 is variably subnetted, 2 subnets, 2 masks
C        193.24.227.0/27 is directly connected, FastEthernet0/0
L        193.24.227.12/32 is directly connected, FastEthernet0/0
router1#
router1#show ipv6 route
IPv6 Routing Table - default - 7 entries
Codes: C - Connected, L - Local, S - Static, U - Per-user Static route
       B - BGP, HA - Home Agent, MR - Mobile Router, R - RIP
       I1 - ISIS L1, I2 - ISIS L2, IA - ISIS interarea, IS - ISIS summary
       D - EIGRP, EX - EIGRP external, NM - NEMO, ND - Neighbor Discovery
       l - LISP
       O - OSPF Intra, OI - OSPF Inter, OE1 - OSPF ext 1, OE2 - OSPF ext 2
       ON1 - OSPF NSSA ext 1, ON2 - OSPF NSSA ext 2
S   ::/0 [1/0]
     via Tunnel0, directly connected
C   2001:470:1F0A:101A::/64 [0/0]
     via Tunnel0, directly connected
L   2001:470:1F0A:101A::2/128 [0/0]
     via Tunnel0, receive
C   2001:470:1F0B:1024::/64 [0/0]
     via FastEthernet0/1, directly connected
L   2001:470:1F0B:1024::1/128 [0/0]
     via FastEthernet0/1, receive
S   2001:470:765B::/48 [1/0]
     via 2001:470:1F0B:1024::2, FastEthernet0/1
L   FF00::/8 [0/0]
     via Null0, receive

Palo Alto with 2x Untrust Interfaces

I am using a PA-220 with PAN-OS 8.1.7 in this lab. Two hardware layer 3 interfaces, one with IPv4-only directly attached to the ISP, the other one with IPv6-only plugged into the Cisco router. Note that both interfaces are of the same “untrust” security zone:

Default IPv6 route pointing to the Cisco router:

One policy to rule them all:

Likewise, the traffic log shows both Internet Protocols from this single policy:

CLI show of routes:

weberjoh@pa> show routing route

flags: A:active, ?:loose, C:connect, H:host, S:static, ~:internal, R:rip, O:ospf, B:bgp,
       Oi:ospf intra-area, Oo:ospf inter-area, O1:ospf ext-type-1, O2:ospf ext-type-2, E:ecmp, M:multicast


VIRTUAL ROUTER: default (id 1)
  ==========
destination                                 nexthop                                 metric flags      age   interface          next-AS
0.0.0.0/0                                   193.24.227.1                            10     A S              ethernet1/1
193.24.227.0/27                             193.24.227.9                            0      A C              ethernet1/1
193.24.227.9/32                             0.0.0.0                                 0      A H
193.24.227.224/27                           193.24.227.225                          0      A C              ethernet1/5.224
193.24.227.225/32                           0.0.0.0                                 0      A H
::/0                                        2001:470:1f0b:1024::1                   10     A S              ethernet1/2
2001:470:1f0b:1024::/64                     2001:470:1f0b:1024::2                   0      A C              ethernet1/2
2001:470:1f0b:1024::2/128                   ::                                      0      A H
2001:470:765b::/64                          2001:470:765b::1                        0      A C              ethernet1/5.224
2001:470:765b::1/128                        ::                                      0      A H
total routes shown: 10

Ping from the trust interface (selected with its source IPv6 address):

weberjoh@pa> ping inet6 yes source 2001:470:765b::1 host weberblog.net
PING weberblog.net(webernetz.net) from 2001:470:765b::1 : 56 data bytes
64 bytes from webernetz.net: icmp_seq=0 ttl=55 time=12.1 ms
64 bytes from webernetz.net: icmp_seq=1 ttl=55 time=5.85 ms
64 bytes from webernetz.net: icmp_seq=2 ttl=55 time=5.90 ms
64 bytes from webernetz.net: icmp_seq=3 ttl=55 time=6.58 ms
64 bytes from webernetz.net: icmp_seq=4 ttl=55 time=5.79 ms
^C
--- weberblog.net ping statistics ---
5 packets transmitted, 5 received, 0% packet loss, time 4043ms
rtt min/avg/max/mdev = 5.794/7.252/12.126/2.453 ms, pipe 2

Traceroute. Its “ipv6 yes” rather than “inet6 yes” as of ping. Uh:

weberjoh@pa> traceroute ipv6 yes source 2001:470:765b::1 host weberblog.net
traceroute to weberblog.net (2a01:488:42:1000:50ed:8588:8a:c570), 30 hops max, 40 byte packets
 1   (2001:470:1f0b:1024::1)  2.255 ms  1.797 ms  2.436 ms
 2  * * *
 3  * * *
 4  * * *
 5  * * *
 6  * * ae4.cr-nashira.cgn1.bb.godaddy.com (2a01:488:bb::f2)  5.888 ms
 7  ae0.cr-artemis.cgn3.hosteurope.de (2a01:488:bb::a3)  5.665 ms  5.618 ms  5.599 ms
 8  2a01:488:42::a1e:1e77 (2a01:488:42::a1e:1e77)  5.578 ms  5.566 ms  5.683 ms
 9  webernetz.net (2a01:488:42:1000:50ed:8588:8a:c570)  6.255 ms  6.238 ms  6.187 ms

Works. Good.

Conclusion

Obviously, I am not happy that Palo Alto Networks has not implemented 6in4 tunnels so far. It shouldn’t be that hard.

However, due to the good design of having security zones summing up multiple interfaces, as well as a single security policy set that is able to handle IPv4 and IPv6 traffic, this workaround is feasible.

(Note that on a FortiGate firewall it’s vice versa: They have 6in4 tunnels but distinct security policies – one for v4 and another one for v6. That is: Quite simple to run a tunnel to HE while quite stupid to have different policy sets. In summary, they aren’t better.)

Featured image “255/365 Umleitung – Selzer Kerb vom 12. bis 16. September” by Frank Hamm is licensed under CC BY-NC-ND 2.0.

Palo Alto Networks Feature Requests

$
0
0

This is a list of missing features for the next-generation firewall from Palo Alto Networks from my point of view (though I have not that many compared to other vendors such as Fortinet). Let’s see whether some of them will find their way into PAN-OS in the next years…

This is a living list. I’ll update it whenever I discover something new.

  • Possibility to disable the “application dependency warning” messages on a per-rule basis. They appear after each commit. Sometimes they are correct – often they aren’t. I have customers with thousands of these warnings while the whole security ruleset is sound and working. In the end, nobody reads these warnings anymore which is contrary to its purpose.
  • IPv6 DHCPv6 Prefix Delegation: In order to operate a Palo Alto at german residential ISP connections, DHCPv6-PD is mandatory. (Sample here.) Since it is working with fairly old Juniper ScreenOS firewalls and even FortiGates, it shouldn’t be that big problem to add it as well. Report.
  • IPv6 6in4 tunnel support. Again, working with ScreenOS and FortiGates out of the box. Report.
  • Email Server Profile with SMTP authentication. That is: Possibility to use a smart host rather than own internal SMTP servers. Report.
  • Precise CLI output whether or not NTP authentication was successful or not. Details here.
  • Grouping of policy entries rather than displaying all at once. Added in PAN-OS 9.0.
  • Dashboard widget to write down some notes. Report.

Featured image “Baustellentick?” by Dennis Skley is licensed under CC BY-ND 2.0.

Palo Alto GRE Tunnel

$
0
0

Since PAN-OS version 9.0 you can configure GRE tunnels on a Palo Alto Networks firewall. Greetings from the clouds. As always, this is done solely through the GUI while you can use some CLI commands to test the tunnel. This time Palo put a little stumbling block in there as you have to allow a GRE connection with a certain zone/IP reference. I will show how to set up such a GRE tunnel between a Palo and a Cisco router. Here we go:

I am using a PA-220 with PAN-OS 9.1.3. This is my addressing scheme:

GRE on the Palo

Configuring a GRE tunnel involves the following steps (refer to the official PAN documentation: GRE Tunnel Overview):

  1. tunnel interface with IP address
  2. GRE tunnel itself
  3. static route (or routing protocol) to the remote network
  4. security policies allowing the internal-to-remote traffic and vice versa
  5. AND: a security policy allowing the incoming GRE tunnel! <- this one is really special as it is from source zone “untrust” with the public IP address of the remote GRE tunnel endpoint to destination zone from the tunnel interface (in my case its called “s2s-gre”) but with the public IP address of the Palo (which resides on the “untrust” zone). RTFM: “Likewise, if the zone of the tunnel interface associated with the GRE tunnel (for example, tunnel.1) is a different zone from that of the ingress interface, you must configure a Security policy rule to allow the GRE traffic.”

Here are some screenshots of my setup:

GRE at Cisco Router

On a Cisco router, the appropriate configuration looks as follows. No security policies here – everything is allowed because it’s a router. The keepalive settings are the defaults. Using only the configuration command

keepalive
defaults to
keepalive 10 3
, which are the same values as on the Palo. (It’s rather likely that PAN took the defaults from Cisco. ;))
interface Tunnel1
 ip address 10.0.7.2 255.255.255.252
 keepalive 10 3
 tunnel source FastEthernet0/0
 tunnel destination 193.24.227.9
!
ip route 193.24.227.224 255.255.255.224 Tunnel1 10.0.7.1


Stats ‘n Troubleshooting

Keep in mind that GRE is *not* a TCP/UDP protocol, but an own IP protocol with number 47. If you have some intermediary firewalls you have to allow this IP protocol. Likewise, the GRE session on the Palo is listed with proto = 47.

Palo Alto

This screenshot shows the traffic log BEFORE I allowed the GRE policy. Of course, they are allowed now. The application is “gre” and the IP protocol is “gre” as well:

GRE sessions are normally quite long-living in the session browser:

The system log, filtered for “subtype eq gre”, shows the tunnel status. For whatever reason I have some more downs than ups:

From the CLI you can ping the other end of the tunnel, sourcing from the own tunnel interface:

weberjoh@pa> ping source 10.0.7.1 host 10.0.7.2
PING 10.0.7.2 (10.0.7.2) from 10.0.7.1 : 56(84) bytes of data.
64 bytes from 10.0.7.2: icmp_seq=1 ttl=255 time=2.91 ms
64 bytes from 10.0.7.2: icmp_seq=2 ttl=255 time=2.86 ms
64 bytes from 10.0.7.2: icmp_seq=3 ttl=255 time=2.70 ms
^C
--- 10.0.7.2 ping statistics ---
3 packets transmitted, 3 received, 0% packet loss, time 2018ms
rtt min/avg/max/mdev = 2.709/2.829/2.911/0.086 ms

And verify the tunnel interface status which shows the GRE stats of the keepalives as well as sent/received bytes/packets:

weberjoh@pa> show interface tunnel.2

--------------------------------------------------------------------------------
Name: tunnel.2, ID: 258
Operation mode: layer3
Virtual router default
Interface MTU 1500
Interface IP address: 10.0.7.1/30
Interface management profile: Ping
  ping: yes  telnet: no  ssh: no  http: no  https: no
  snmp: no  response-pages: no  userid-service: no
Service configured:
Zone: s2s-gre, virtual system: vsys1
Adjust TCP MSS: no
Policing: no
--------------------------------------------------------------------------------
GRE tunnel name:               R1
tunnel interface state:        Up
disabled:                      False
copy-tos:                      False
keep alive enabled:            True
local-ip:                      193.24.227.9
peer-ip:                       193.24.225.54
stats:
   ka-id:                      3847
   ka-send:                    3847
   ka-recv:                    3846
   ka-curr-retry:              0
   ka-last-timestamp:          1287801
   ka-recv-map:                0
   ka-owner:                   0
--------------------------------------------------------------------------------
Logical interface counters read from CPU:
--------------------------------------------------------------------------------
bytes received                           3942406917
bytes transmitted                        95892322
packets received                         2794777
packets transmitted                      1509634
receive errors                           0
packets dropped                          8
packets dropped by flow state check      0
forwarding errors                        0
no route                                 0
arp not found                            0
neighbor not found                       0
neighbor info pending                    0
mac not found                            0
packets routed to different zone         0
land attacks                             0
ping-of-death attacks                    0
teardrop attacks                         0
ip spoof attacks                         0
mac spoof attacks                        0
ICMP fragment                            0
layer2 encapsulated packets              0
layer2 decapsulated packets              0
tcp cps                                  0
udp cps                                  0
sctp cps                                 0
other cps                                0
--------------------------------------------------------------------------------

Cisco Router

Pinging the other tunnel interface:

R1#ping 10.0.7.1
Type escape sequence to abort.
Sending 5, 100-byte ICMP Echos to 10.0.7.1, timeout is 2 seconds:
!!!!!
Success rate is 100 percent (5/5), round-trip min/avg/max = 1/3/4 ms

Tunnel interface status:

R1#show interfaces Tunnel 1
Tunnel1 is up, line protocol is up
  Hardware is Tunnel
  Internet address is 10.0.7.2/30
  MTU 17916 bytes, BW 100 Kbit/sec, DLY 50000 usec,
     reliability 255/255, txload 255/255, rxload 20/255
  Encapsulation TUNNEL, loopback not set
  Keepalive set (10 sec), retries 3
  Tunnel source 193.24.225.54 (FastEthernet0/0), destination 193.24.227.9
   Tunnel Subblocks:
      src-track:
         Tunnel1 source tracking subblock associated with FastEthernet0/0
          Set of tunnels with source FastEthernet0/0, 1 member (includes iterators), on interface <OK>
  Tunnel protocol/transport GRE/IP
    Key disabled, sequencing disabled
    Checksumming of packets disabled
  Tunnel TTL 255, Fast tunneling enabled
  Tunnel transport MTU 1476 bytes
  Tunnel transmit bandwidth 8000 (kbps)
  Tunnel receive bandwidth 8000 (kbps)
  Last input 00:01:36, output 00:00:04, output hang never
  Last clearing of "show interface" counters never
  Input queue: 0/75/0/0 (size/max/drops/flushes); Total output drops: 0
  Queueing strategy: fifo
  Output queue: 0/0 (size/max)
  5 minute input rate 8000 bits/sec, 16 packets/sec
  5 minute output rate 177000 bits/sec, 30 packets/sec
     1513537 packets input, 96737817 bytes, 0 no buffer
     Received 0 broadcasts (0 IP multicasts)
     0 runts, 0 giants, 0 throttles
     0 input errors, 0 CRC, 0 frame, 0 overrun, 0 ignored, 0 abort
     2801599 packets output, 3978753521 bytes, 0 underruns
     0 output errors, 0 collisions, 0 interface resets
     0 unknown protocol drops
     0 output buffer failures, 0 output buffers swapped out


(Sorry for being legacy-IP-only this time…)

Photo by Sharosh Rajasekher on Unsplash.

Route-Based VPN Tunnel Palo Alto Cisco ASA

$
0
0

More than 6 years ago (!) I published a tutorial on how to set up an IPsec VPN tunnel between a Palo Alto Networks firewall and a Cisco ASA. As time flies by, ASA is now able to terminate route-based VPN tunnels (which is great!), we have IKEv2 running everywhere and enhanced security proposals. Hence, it’s time for an update:

This is one of many VPN tutorials on my blog. –> Have a look at this full list. <–

My Setup

This is my setup for this tutorial: (Yes, public IPv4 addresses behind the Palo.)

I am using a Palo Alto Networks PA-220 with PAN-OS 10.0.2 and a Cisco ASA 5515 with version 9.12(3)12 and ASDM 7.14(1). These are the VPN parameters:

  • Route-based VPN, that is: numbered tunnel interface and real route entries for the network(s) to the other side. But no proxy-IDs aka traffic selection aka crypto map. Thank goodness for that.
  • IKEv2 (no distinction anymore between main or aggressive mode as with IKEv1)
  • PSK: 30 chars alphanumeric, generated with a password generator! (ref)
  • IKE crypto/policies:
    • Diffie-Hellman group 20
    • AES-256-CBC (because Palo has no -GCM here, don’t know why)
    • SHA-512 (you could use SHA-256 if you like)
    • 8 hours
  • IPsec crypto/proposals/transform sets:
    • AES-256-GCM (here it is GCM)
    • SHA-512 (again, you can use SHA-256 as well)
    • Diffie-Hellman group 20
    • 1 hour
  • Tunnel monitor on the Palo to ping the tunnel interface of the ASA constantly – this keeps the tunnel up and running.
  • Since there is the “intrazone-default allow” policy on the Palo, you don’t need an explicit policy for allowing the VPN connection from “untrust to untrust”. If you have an own explicit deny any policy at the end of your policy set, you need an explicit allow policy for “ike” and “ipsec-esp”.
  • No NAT between the internal networks (of course not ;))!

Palo Alto NGFW

Everything is done via the GUI:

Cisco ASA

You can do the configuration either via the ASDM “GUI”:

or through CLI commands (of course you have to change the IPv4 addresses, the PSK, the number of the VTI or the crypto ikev2 policy, etc.) Furthermore, the ACL is not listed:

interface Tunnel2
 nameif pa
 ip address 10.1.227.2 255.255.255.252
 tunnel source interface outside
 tunnel destination 193.24.227.9
 tunnel mode ipsec ipv4
 tunnel protection ipsec profile aes256gcm-sha512-dh20-3600s
!
route pa 193.24.227.224 255.255.255.224 10.1.227.1 1
!
crypto ipsec ikev2 ipsec-proposal aes256gcm-sha512
 protocol esp encryption aes-gcm-256
 protocol esp integrity sha-512
crypto ipsec profile aes256gcm-sha512-dh20-3600s
 set ikev2 ipsec-proposal aes256gcm-sha512
 set pfs group20
 set security-association lifetime seconds 3600
crypto ikev2 policy 2
 encryption aes-256
 integrity sha512
 group 20
 prf sha512
 lifetime seconds 28800
!
group-policy 193.24.227.9 internal
group-policy 193.24.227.9 attributes
 vpn-tunnel-protocol ikev2
tunnel-group 193.24.227.9 type ipsec-l2l
tunnel-group 193.24.227.9 general-attributes
 default-group-policy 193.24.227.9
tunnel-group 193.24.227.9 ipsec-attributes
 ikev2 remote-authentication pre-shared-key ThisIsThePreSharedKey
 ikev2 local-authentication pre-shared-key ThisIsThePreSharedKey


Monitoring

On the Palo you can see these information in the GUI:

Or you can use some of these CLI commands show vpn { ike-sa | ipsec-sa | gateway | tunnel | flow } :

weberjoh@pa> show vpn ike-sa gateway asa

There is no IKEv1 phase-1 SA found.

There is no IKEv1 phase-2 SA found.


IKEv2 SAs
Gateway ID      Peer-Address           Gateway Name           Role SN       Algorithm             Established     Expiration      Xt Child  ST
----------      ------------           ------------           ---- --       ---------             -----------     ----------      -- -----  --
2               185.23.77.7            asa                    Init 90       PSK/DH20/A256/SHA512  Oct.07 14:23:04 Oct.07 22:23:04 0  1      Established         

IKEv2 IPSec Child SAs
Gateway Name           TnID     Tunnel                    ID       Parent   Role SPI(in)  SPI(out) MsgID    ST
------------           ----     ------                    --       ------   ---- -------  -------- -----    --
asa                    4        asa                       390604   90       Init D8EF49DF CF6D9FC7 00000793 Mature

Show IKEv2 SA: Total 2 gateways found. 1 ike sa found.

weberjoh@pa>
weberjoh@pa>
weberjoh@pa> show vpn ipsec-sa tunnel asa

GwID/client IP  TnID   Peer-Address           Tunnel(Gateway)                                Algorithm          SPI(in)  SPI(out) life(Sec/KB)             remain-time(Sec)
--------------  ----   ------------           ---------------                                ---------          -------  -------- ------------             ----------------
2               4      185.23.77.7            asa(asa)                                       ESP/G256/          D8EF49DF CF6D9FC7 3600/Unlimited           1185 

Show IPSec SA: Total 1 tunnels found. 1 ipsec sa found.

weberjoh@pa>
weberjoh@pa>
weberjoh@pa> show vpn gateway name asa

GwID     Name                 Peer-Address/ID                Local Address/ID               Protocol    Proposals                                               
----     ----                 ---------------                ----------------               --------    ---------                                               
2        asa                  185.23.77.7                    193.24.227.9(ipaddr:193.24.227 IKEv2       [PSK][DH20][AES256][SHA512]28800-sec                    

IKEv2 cookie will be enabled if the number of half opened SA is over 500
IKEv2 max allowed half opened SA: 65535

weberjoh@pa>
weberjoh@pa>
weberjoh@pa> show vpn tunnel name asa

TnID   Name                           Gateway              Local Proxy IP       Ptl:Port   Remote Proxy IP      Ptl:Port   Proposals                            
----   ----                           -------              --------------       --------   ---------------      --------   ---------                            
4      asa                            asa                  0.0.0.0/0            0:0        0.0.0.0/0            0:0        ESP tunl [DH20][AES256-GCM16][SHA512] 3600-sec 0-kb

Show IPSec tunnel config: Total 1 tunnels found.

weberjoh@pa>
weberjoh@pa>
weberjoh@pa> show vpn flow name asa

tunnel  asa
        id:                     4
        type:                   IPSec
        gateway id:             2
        local ip:               193.24.227.9
        peer ip:                185.23.77.7
        inner interface:        tunnel.4
        outer interface:        ethernet1/1
        state:                  active
        session:                62916
        tunnel mtu:             1432
        soft lifetime:          3494
        hard lifetime:          3600
        lifetime remain:        1075 sec
        lifesize remain:        N/A
        latest rekey:           2525 seconds ago
        monitor:                on
          monitor status:       up
          monitor dest:         10.1.227.2
          monitor interval:     3 seconds
          monitor threshold:    5 probe losses
          monitor bitmap:       11111
          monitor packets sent: 318909
          monitor packets recv: 318905
          monitor packets seen: 0
          monitor packets reply:0
        en/decap context:       967
        local spi:              D8EF49DF
        remote spi:             CF6D9FC7
        key type:               auto key
        protocol:               ESP
        auth algorithm:         NULL
        enc  algorithm:         AES256GCM16
        traffic selector:
          protocol:             0
          local ip range:       0.0.0.0 - 255.255.255.255
          local port range:     0 - 65535
          remote ip range:      0.0.0.0 - 255.255.255.255
          remote port range:    0 - 65535
        anti replay check:      yes
        copy tos:               no
        enable gre encap:       no
        initiator:              yes
        authentication errors:  0
        decryption errors:      0
        inner packet warnings:  0
        replay packets:         0
        packets received
          when lifetime expired:0
          when lifesize expired:0
        sending sequence:       1224
        receive sequence:       1215
        encap packets:          324665
        decap packets:          324016
        encap bytes:            38722120
        decap bytes:            36924228
        key acquire requests:   14
        owner state:            0
        owner cpuid:            s1dp0
        ownership:              1


On the ASA these are the GUI information. Note the proxy-IDs aka “Local Addr. / Subnet Mask / Protocol / Port” which is “0.0.0.0/0.0.0.0/0/0” which is absolutely correct, due to the usage of a route-based VPN. Nice!

And here are some CLI commands as well. Note that you have a valid static route to the other side, which is great!

asa# show crypto ikev2 sa detail

IKEv2 SAs:

Session-id:14, Status:UP-ACTIVE, IKE count:1, CHILD count:1

Tunnel-id Local                                               Remote                                                  Status         Role
1064907123 185.23.77.7/500                                     193.24.227.9/500                                         READY    RESPONDER
      Encr: AES-CBC, keysize: 256, Hash: SHA512, DH Grp:20, Auth sign: PSK, Auth verify: PSK
      Life/Active Time: 28800/19548 sec
      Session-id: 14
      Status Description: Negotiation done
      Local spi: 7717F9B4C00B4B1F       Remote spi: 9C74DCB332A67F2C
      Local id: 185.23.77.7
      Remote id: 193.24.227.9
      Local req mess id: 3              Remote req mess id: 3911
      Local next mess id: 3             Remote next mess id: 3911
      Local req queued: 3               Remote req queued: 3911
      Local window: 1                   Remote window: 1
      DPD configured for 10 seconds, retry 2
      NAT-T is not detected
      IKEv2 Fragmentation Configured MTU: 576 bytes, Overhead: 28 bytes, Effective MTU: 548 bytes
Child sa: local selector  0.0.0.0/0 - 255.255.255.255/65535
          remote selector 0.0.0.0/0 - 255.255.255.255/65535
          ESP spi in/out: 0x608b2209/0xe8a8c944
          AH spi in/out: 0x0/0x0
          CPI in/out: 0x0/0x0
          Encr: AES-GCM, keysize: 256, esp_hmac: N/A
          ah_hmac: None, comp: IPCOMP_NONE, mode tunnel
Parent SA Extended Status:
      Delete in progress: FALSE
      Marked for delete: FALSE

asa#
asa#
asa# show crypto ipsec sa peer 193.24.227.9 detail
peer address: 193.24.227.9
    Crypto map tag: __vti-crypto-map-6-0-2, seq num: 65280, local addr: 185.23.77.7

      local ident (addr/mask/prot/port): (0.0.0.0/0.0.0.0/0/0)
      remote ident (addr/mask/prot/port): (0.0.0.0/0.0.0.0/0/0)
      current_peer: 193.24.227.9


      #pkts encaps: 35910, #pkts encrypt: 35910, #pkts digest: 35910
      #pkts decaps: 23421, #pkts decrypt: 23421, #pkts verify: 23421
      #pkts compressed: 0, #pkts decompressed: 0
      #pkts not compressed: 35910, #pkts comp failed: 0, #pkts decomp failed: 0
      #pre-frag successes: 0, #pre-frag failures: 0, #fragments created: 0
      #PMTUs sent: 0, #PMTUs rcvd: 0, #decapsulated frgs needing reassembly: 0
      #TFC rcvd: 0, #TFC sent: 0
      #Valid ICMP Errors rcvd: 0, #Invalid ICMP Errors rcvd: 0
      #pkts no sa (send): 0, #pkts invalid sa (rcv): 0
      #pkts encaps failed (send): 0, #pkts decaps failed (rcv): 0
      #pkts invalid prot (rcv): 0, #pkts verify failed: 0
      #pkts invalid identity (rcv): 0, #pkts invalid len (rcv): 3974389472
      #pkts invalid pad (rcv): 0,
      #pkts invalid ip version (send): 0, #pkts invalid ip version (rcv): 0
      #pkts invalid len (send): 0, #pkts invalid len (rcv): 0
      #pkts invalid ctx (send): 0, #pkts invalid ctx (rcv): 0
      #pkts invalid ifc (send): 0, #pkts invalid ifc (rcv): 0
      #pkts failed (send): 0, #pkts failed (rcv): 0
      #pkts replay rollover (send): 0, #pkts replay rollover (rcv): 0
      #pkts replay failed (rcv): 0
      #pkts min mtu frag failed (send): 0, #pkts bad frag offset (rcv): 0
      #pkts internal err (send): 0, #pkts internal err (rcv): 0

      local crypto endpt.: 185.23.77.7/500, remote crypto endpt.: 193.24.227.9/500
      path mtu 1500, ipsec overhead 55(36), media mtu 1500
      PMTU time remaining (sec): 0, DF policy: copy-df
      ICMP error validation: disabled, TFC packets: disabled
      current outbound spi: E8A8C944
      current inbound spi : 608B2209

    inbound esp sas:
      spi: 0x608B2209 (1619730953)
         SA State: active
         transform: esp-aes-gcm-256 esp-null-hmac no compression
         in use settings ={L2L, Tunnel, PFS Group 20, IKEv2, VTI, }
         slot: 0, conn_id: 41, crypto-map: __vti-crypto-map-6-0-2
         sa timing: remaining key lifetime (kB/sec): (3962843/2426)
         IV size: 8 bytes
         replay detection support: Y
         Anti replay bitmap:
          0xFFFFFFFF 0xFFFFFFFF
    outbound esp sas:
      spi: 0xE8A8C944 (3903375684)
         SA State: active
         transform: esp-aes-gcm-256 esp-null-hmac no compression
         in use settings ={L2L, Tunnel, PFS Group 20, IKEv2, VTI, }
         slot: 0, conn_id: 41, crypto-map: __vti-crypto-map-6-0-2
         sa timing: remaining key lifetime (kB/sec): (3916764/2426)
         IV size: 8 bytes
         replay detection support: Y
         Anti replay bitmap:
          0x00000000 0x00000001

asa#
asa#
asa# show route static

Codes: L - local, C - connected, S - static, R - RIP, M - mobile, B - BGP
       D - EIGRP, EX - EIGRP external, O - OSPF, IA - OSPF inter area
       N1 - OSPF NSSA external type 1, N2 - OSPF NSSA external type 2
       E1 - OSPF external type 1, E2 - OSPF external type 2, V - VPN
       i - IS-IS, su - IS-IS summary, L1 - IS-IS level-1, L2 - IS-IS level-2
       ia - IS-IS inter area, * - candidate default, U - per-user static route
       o - ODR, P - periodic downloaded static route, + - replicated route
Gateway of last resort is 185.23.77.1 to network 0.0.0.0

S*       0.0.0.0 0.0.0.0 [1/0] via 185.23.77.1, outside
S        193.24.227.224 255.255.255.224 [1/0] via 10.1.227.1, pa


PS: Sorry for being legacy IP only this time. ;(

Photo by Mathew Schwartz on Unsplash.

Palo Alto Networks Cluster “not synchronized”

$
0
0

For whatever reason, I had a Palo Alto Networks cluster that was not able to sync. A manual sync was not working, nor did a reboot of both devices (sequentially) help. Finally, the PAN support told me to “Export device state” on the active unit, import it on the passive one, do some changes, and commit. Indeed, this fixed it. A little more details:

I was running a PA-820 cluster with PAN-OS 8.1.13. Screenshot from the dashboard:

Some system logs:

I wanted to do some OS upgrades but wanted to fix this error before, of course.

This finally made it:

  1. Export of the “device state” from the active device. Device -> Setup -> Operations -> “Export device state”.
  2. Now on the passive device: “Import device state”. DO NOT COMMIT YET!
  3. Change the following settings on the passive device:
    • hostname & login banner (if specific)
    • management IP settings
    • HA settings
  4. Commit on the passive device.

Worked for me. Though I do not know why this happened at all…

Photo by Gabriel Gusmao on Unsplash.

Palo Alto: User Group Count Exceeds Threshold

$
0
0

We have run into an annoying situation: A hardware-dependent limit of user groups on a Palo Alto Next-Generation Firewall. That is: We cannot use more Active Directory groups at our firewalls. The weird thing about this: We don’t need that many synced groups on our Palo, but we have to do it that way since we are using nested groups for our users. That is: Palo Alto does not support nested groups out of the box, but needs all intermediary groups to retrieve the users which results in a big number of unnecessary groups.

I am asking you to give me some input on how you’re using user groups on the Palo. How are you using group filters? What count of AD groups do you have? Are you using nested groups (which is best practice)?

This is our main problem on a PA-5220: “User Group count of xyz exceeds threshold of 10000”:

Same on a PA-820, where the limit is 1000:

How we are using AD groups

TL;DR: Our users are member of container groups, which are member of different permission groups, e.g., “firewall” groups. We are using *only* such firewall groups in our Palo Alto policies, while users are only in the container groups.

A good article describing those nested groups permissions is here: Active Directory nesting groups strategy and implementation.

The Palo Problem

On a Palo, the user groups are synced from the Active Directory (LDAP profile) within Device -> User Identification -> Group Mapping Settings. The “Search Filter” limits the groups. In our case, we would *only* need our firewall groups. The “Group Member” attribute is set to “member” by default:

Using this setup, we are NOT retrieving users within our groups at all. :( In order to retrieve the users, we have to include the full path from our user groups to our firewall groups. (PAN: Nested User Groups in User-ID) In our case, this is:

Doing it that way, we now have all users listed within our firewall groups. Good so far. BUT:

Using about 2000 firewall groups in our PA-5220 (distributed among several VSYSes), we now need about 10000 groups to sync into the Palo for our users to belong to the right groups. This brings us to the hardware limit. :(

The key question is: Why is Palo Alto, read: the LDAP implementation, not able to crawl the users within nested groups without having to retrieve all intermediary groups?!?

(Not-working-) Ideas

We googled a lot, opened a support ticket and had several discussions with colleagues and Palo SEs. Along with packet captures and Wireshark deep dives to understand how the LDAP queries are working. ;) Here are a couple of ideas that are all not feasible for us:

  • Using a special LDAP search string for the group member attribute: “1.2.840.113556.1.4.1941“, LDAP_MATCHING_RULE_IN_CHAIN. We tried different settings such as “member:1.2.840.113556.1.4.1941:” or “(member:1.2.840.113556.1.4.1941:={0})”. Though we were able commit, no users came in.
  • Using the msds-memberTransitive attribute (link) for the group member. In theory a very good idea: Using this attribute for querying a group, the LDAP server returns all users that reside in subjacent groups. Nice! Indeed, this solved our issue. If Palo Alto didn’t have a bug right there. :( In fact, for every 11th group refresh, the Palo does a full sync which failed using this attribute. For some complex reasons. PAN engineering confirmed this erroneous behaviour, however, “this cannot be fixed”. Every 11th time the “msds-memberTransitive” is used for an LDAP search request but without specifying a base object. Hence the AD is not able to answer this extensive search and replies with an error: “00002120: SvcErr: DSID-03120451, problem 5012 (DIR_ERROR), data 592062”. Here’s how we used it:
  • Manually using the “Group Include List“. Sure, googling for our problem this is the first article which shows how to use the include list. In my opinion, this is ridiculous. We are using a couple of VSYSes with some more AD domains, having new (or obsolete) groups every now and then. Having to specify the relevant groups manually would be a major step back. Please note: We are using a Next-Generation firewall here!
  • Rebuilding our AD into another design without using nested groups. Well. Yeah. Thanks for the idea.

In the end, the support from PAN told us to ask for a feature request. Hm. Obviously, they are not accepting it as a bug, though engineering confirmed it…

Are we the only ones running into this?

Again, I am highly interested in how you are using groups in your AD and within your Palo policies. How do you remain below the threshold of user groups? –> Please write a comment below!

Appendix: Used CLI commands

show user group-mapping statistics
show user group list | match prod_fw_example1
show user group name "abraham\prod_fw_example1"
show user user-ids match-user weberjoh

debug user-id reset group-mapping all

debug user-id on debug
debug user-id set ldap basic
debug user-id off

tcpdump snaplen 0 filter "host 198.51.100.42 and port 389"
scp export mgmt-pcap from mgmt.pcap to weberjoh@lx.weberlab.de:.
Photo by Jonathan Ford on Unsplash.

Palo Alto Syslog via TLS

$
0
0

As we have just set up a TLS capable syslog server, let’s configure a Palo Alto Networks firewall to send syslog messages via an encrypted channel. While it was quite straightforward to configure I ran into a couple of (unresolved) problems as I added and deleted some syslog servers and their certificates. Uhm.

Syslog & Certificate Configuration

I am using a PA-220 with PAN-OS 10.0.7 for this setup. My syslog-ng server with version 3.25.1 is running on a Ubuntu 20.04.3 LTS.

Basically, you just have to set the transport of a syslog server to “SSL”. (For whatever reason it’s still named SSL. It should read TLS since a couple of years.) I am using the “IETF” format nowadays. This seems to be the more modern standard, refer to RFC 5424 Appendix A.1. Though I don’t see any obvious differences between the BSD and the IETF type.

If you’re doing an immediate commit you will see these system logs:

Syslog  SSL error while writing stream; tls_error='SSL routines:SSL3_GET_SERVER_CERTIFICATE:certificate verify failed'

Screenshot:

–> This is because I am using a self-signed x.509 certificate on my syslog-ng server which is not trusted indeed. Good so far!

The same errors are appearing at the /var/log/syslog log file on the syslog-ng server itself:

Sep 30 08:30:19 vm32-test2 syslog-ng[6111]: Syslog connection accepted; fd='42', client='AF_INET6([::ffff:94.31.107.114]:43087)', local='AF_INET6([::]:6514)'
Sep 30 08:30:19 vm32-test2 syslog-ng[6111]: SSL error while reading stream; tls_error='SSL routines:ssl3_read_bytes:tlsv1 alert unknown ca', location='/etc/syslog-ng/conf.d/generic.conf:28:17'
Sep 30 08:30:19 vm32-test2 syslog-ng[6111]: Error reading RFC6587 style framed data; fd='42', error='Connection reset by peer (104)'
Sep 30 08:30:19 vm32-test2 syslog-ng[6111]: Syslog connection closed; fd='42', client='AF_INET6([::ffff:94.31.107.114]:43087)', local='AF_INET6([::]:6514)'

You have to import the certificate of the syslog-ng server into the Palo as well:

Now it’s working. ;)

Note that for some reason the Palo does NOT use IPv6 for this outgoing syslog connection, though my FQDN had an AAAA record at the time of writing and the syslog server itself was accessible.

weberjoh@nb15-lx:~$ host test2.weberlab.de
test2.weberlab.de has address 194.247.5.27
test2.weberlab.de has IPv6 address 2001:470:1f0b:16b0:20c:29ff:fea8:26f7

This is what the legacy IP TLS connection looks like with Wireshark:

Some maloperations?!?

Since I wanted to use IPv6, I configured the IPv6 address of the syslog-ng server manually:

The TCP handshake to the syslog server worked, but no TLS connection was established. I got the same errors in the system log:

And this is it in Wireshark:

After trying that I decided to go back to the FQDN of my syslog-ng server to let the Palo use it with legacy IP. However, I was not able to get it working again at all! I tried the following:

  1. without certificate -> not working
  2. imported certificate -> working
  3. deleted certificate -> still working (!!!???)
  4. change of the syslog server to a dummy
  5. change back to my real one -> not working (ok)
  6. imported certificate again -> still not working (not ok!)
  7. reboot of the whole device -> still not working

Hence I suppose some kind of bugs here. :(

Anyway, lessons learned:

For every new logging device you MUST verify that log messages arrive at the destined syslog server correctly.

Photo by Claudio Testa on Unsplash.


PAN: Logging of Packet-Based Attack Protection Events e.g. Spoofed IP

$
0
0

I just had a hard time figuring out that a network routing setup was not working due to a correctly enforced IP Spoofing protection on a Palo Alto Networks firewall. Why was it a hard time? Because I did not catch that the IP spoofing protection kicked in since there were no logs. And since we do log *everything*, a non-existent log means nothing happened, right? Uhm, not in this case. Luckily you can (SHOULD!) enable an additional thread log on the Palo.

The exception proves the rule. That is: blocks/drops that are enforced with these options are NOT logged in any way within the GUI:

The only way to find some drops, e.g., spoofed IP addresses (aka unicast reverse path forwarding), was the global counters along with an appropriate packet filter (from the GUI at Monitor -> Packet Capture):

weberjoh@pa(active)> show counter global filter packet-filter yes | match spoof
flow_dos_pf_ipspoof    1908     0 drop   flow   dos    Packets dropped: Zone protection option 'discard-ip-spoof'

Investigating IP Drops (amongst others)

With PAN-OS 8.1.2, Palo Alto Networks released a new feature: “Logging of Packet-Based Attack Protection Events“. With this feature, all (?) protections are logged in the threat log which is accessible through the GUI.

You have to enable this feature on every single firewall in question in order to see those logs in the threat log:
set system setting additional-threat-log on
Some notes about this CLI command:
  • it does not require a reboot -> it is live instantly
  • it is persistent, that is: it survives a reboot of the firewall
  • it is NOT part of the configuration file -> if you’re doing an RMA or a tech refresh you have to set it again!
  • it is NOT synced within an HA cluster -> you have to enable it on every single firewall
  • you can verify whether or not this logging feature is enabled with the following command: show system state filter cfg.general.additional-threat-log

However, please enable it carefully to not overwhelm your logs. ;)

This is how I’ve done it on one of my firewalls. Checked it, enabled it, checked it again:

weberjoh@pa(passive)> show system state filter cfg.general.additional-threat-log

'cfg.general.additional-threat-log': NO_MATCHES

weberjoh@pa(passive)>
weberjoh@pa(passive)> set system setting additional-threat-log on

weberjoh@pa(passive)>
weberjoh@pa(passive)> show system state filter cfg.general.additional-threat-log

cfg.general.additional-threat-log: True

weberjoh@pa(passive)>

And this is what the protection against IP spoofs looks like in the threat log:

By the way: Google pointed me to the solution on Reddit respectively Palo Altos LIVEcommunity. Meanwhile, I was confused by a new feature from PAN in a non .0 PAN-OS version. Anyway, some more feature requests to Palo Alto Networks:

  • Feature request #1: enabling/disabling this feature through the GUI just like any other feature.
  • Feature request #2: adding a big sign at the zone protection profile about these probably not logged blocks.

Photo by Lucas Alexander on Unsplash.

Palo Packet Capture: Choosing the Right Filter

$
0
0

Palo Alto firewalls have a nice packet capture feature. It enables you to capture packets as they traverse the firewall. While you might be familiar with the four stages that the Palo can capture (firewall, drop, transmit, receive), it’s sometimes hard to set the correct filter – especially when it comes to NAT scenarios. (At least it was hard for me…)

I am using the packet capture feature very often for scenarios in which the IP connections are in fact working (hence no problems at the tx/rx level nor on the security policy/profile) but where I want to verify certain details of the connection itself. I’m simply using the Palo as a capturing device here, similar to a SPAN port on a switch. (Yes, I’m aware of all disadvantages of not using a real TAP and a real capture device.) In the end, I want a single pcap which shows all relevant packets for a client-server connection, even if NAT is in place. Wireshark should be able to correlate the incoming/outgoing packets into a single TCP stream. Furthermore, I definitely want to use a filter to limit the amount of captured packets. This is how I’m doing it:

I am using a PA-220 with PAN-OS 10.0.10. The screenshots are from Wireshark version 3.6.5. For the sake of simplicity, I’m only using IP addresses in the filters, not ports. To my mind, this is a reasonable tradeoff between “filtering but not too complicated”. I’m always enabling the “pre-parse match” checkbox. (Has anyone ever had a case where this checkmark saved four life? Please write a comment if so!) In addition, I’m always capturing at all four stages. For all the following tests, I did a ping followed by an SSH connection attempt.

This was my test setup:

Scenario 1: End-to-End Communication w/o NAT

Ok, that’s an easy one. Simply use a single filter statement for your client -> server. Returning traffic is captured automatically. (I wasn’t sure about this for a long time.) No need for a second statement such as server -> client.

Capturing all four stages, the firewall stage has everything captured, hence Wireshark is able to correlate the echo-request/-replies as well as the whole TCP/SSH session. Never mind of the VLAN tag that is present on only one side of the connection since my client network is within VLAN 69 at this point while the other interface is untagged.

Scenario 2: Internal Client -> External Server with outgoing SNAT/PAT aka “Dynamic IP And Port”

Now here’s the trick: I’m still using a single filter statement with the internal RFC1918 IPv4 address as the source and the public server IPv4 address as the destination:

Looking at the firewall, receive, and transmit stage, none of them is complete. The firewall stage only lists the outgoing direction (RFC1918 -> dest) since the returning traffic is still NATted, hence the filter is not working; the receive stage captured the outgoing traffic (RFC1918 -> dest) and the returning, but NATed (dest -> SNAT), hence no correlation in Wireshark as well; and the transmit stage captured only the returning traffic (dest -> RFC1918):

BUT: merging the firewall & the transmit stages gives a perfectly correlated pcap. Yee-haw!

You can do this merge directly within Wireshark. Simply open the first capture, then File -> Merge… and select the second one. (Unfortunately, this merge trick with Wireshark is only working for two pcaps. :( If you have more than two to merge, you have to use mergecap.exe.)

In the end, this is it: a single view in Wireshark, ping request/replies and a single and complete TCP stream:

(I also tried other filter settings such as this:

which did not lead to a single capture file from a single stage to have all streams correlated correctly. Hence I’m staying with the upper approach.)

If you prefer to have the “SNAT IP -> server IP” in the capture, you can use the same trick but with the following filter, which exactly matches the SNAT -> dest IPs:

Gives this:

Scenario 3: Incoming DNAT Connection

Let’s have a look at the classical DNAT scenario: You’re hosting a server with internal RFC1918 addresses with a DNAT policy. Now the client is on the Internet and your server on the internal network. Again, two working filter setups.

1) public client -> public DNAT:

Merging the firewall and the transmit stage:

2) public client again -> RFC1918 address:

Merging fw & tx:

Conclusion

I’m still not sure whether this is the best way to do it. If you have better filter ideas, please write a comment. However, having this post as a reminder for myself, I’m fine with it.

By the way: With IPv6, we won’t have this problem with NAT anymore. ;)

Photo by Rae Wallis on Unsplash.

Linux’ Traceroute

$
0
0

The other day I just wanted to capture some basic Linux traceroutes but ended up troubleshooting different traceroute commands and Wireshark display anomalies. Sigh. Anyway, I just added a few Linux traceroute captures – legacy and IPv6 – to the Ultimate PCAP. Here are some details:

Yep, I was shocked myself, but while I had some Windows traceroutes (based on ICMP echo-requests) and even some layer 4 traceroutes (sending TCP SYNs, e.g.) in the Ultimate PCAP, I was missing a generic Linux traceroute that uses UDP datagrams to destination ports ≥ 33434 for it. So, here we are.

Traceroute with Legacy IP

I used an Ubuntu 16.04.7 LTS (GNU/Linux 4.4.0-234-generic x86_64):

weberjoh@nb15-lx:~$ traceroute -V
Modern traceroute for Linux, version 2.0.21
Copyright (c) 2008  Dmitry Butskoy,   License: GPL v2 or any later
weberjoh@nb15-lx:~$
weberjoh@nb15-lx:~$
weberjoh@nb15-lx:~$ traceroute netsec.blog
traceroute to netsec.blog (5.35.226.136), 30 hops max, 60 byte packets
 1  192.168.3.1 (192.168.3.1)  14.003 ms  13.960 ms  13.932 ms
 2  ip-037-024-166-081.um08.pools.vodafone-ip.de (37.24.166.81)  15.423 ms  16.794 ms  15.892 ms
 3  ip-178-200-118-001.um45.pools.vodafone-ip.de (178.200.118.1)  29.912 ms  33.328 ms  33.087 ms
 4  ip-081-210-129-132.um21.pools.vodafone-ip.de (81.210.129.132)  32.901 ms  33.709 ms  33.813 ms
 5  de-fra04d-rc1-ae-7-0.aorta.net (84.116.197.245)  41.520 ms  41.025 ms  40.964 ms
 6  de-fra04c-ri1-ae15-101.aorta.net (84.116.191.6)  37.400 ms  18.572 ms  18.346 ms
 7  et-7-0-0-u100.fra1-cr-polaris.bb.gdinf.net (80.81.192.239)  20.243 ms  20.314 ms  20.112 ms
 8  ae0.fra10-cr-antares.bb.gdinf.net (87.230.115.1)  20.941 ms  20.509 ms  24.838 ms
 9  ae2.cgn1-cr-nashira.bb.gdinf.net (87.230.114.4)  25.985 ms  26.216 ms  26.038 ms
10  ae0.100.sr-jake.cgn1.dcnet-emea.godaddy.com (87.230.114.222)  38.922 ms  38.912 ms  24.242 ms
11  * * *
12  wp367.webpack.hosteurope.de (5.35.226.136)  23.472 ms  23.407 ms  19.353 ms

Pro-tip for Wireshark: Use a custom column which shows the hop limit (IPv6) and TTL (IPv4) in one column:

By default, traceroute sends three packets with the same hop limit/TTL starting by 1. This results in various UDP streams. At the time of writing with Wireshark version 4.0.1, the coloring of those packets is this: the first 12 UDP streams are marked red (TTL 1-4), while the other ones aren’t. (We are currently discussing the default coloring rules here at the Wireshark issues pages.) Right after it, the ICMP “time-to-live exceeded” error messages came in, while traceroute itself sent out various reverse DNS queries (omitted in the following screenshot):

This was the moment when I discovered a small bug within Wireshark (from my point of view), namely that the connecting line for ICMP errors is not working in both directions.

traceroute6 ≠ traceroute -6

Then it turned a little strange. I was always confused about which CLI command I should use for ping and/or traceroute for IPv6: traceroute6 or traceroute -6. The man page from traceroute states:

traceroute6 is equivalent to traceroute -6

While the man page from traceroute6 states:

Description can be found in traceroute(8), all the references to IP replaced to IPv6. It is needless to copy the description from there.
Hence they should definitely be the same, right? … Unfortunately, they aren’t.

This is a traceroute6 call:

weberjoh@nb15-lx:~$ traceroute6 -V
traceroute6 utility, iputils-s20121221
weberjoh@nb15-lx:~$
weberjoh@nb15-lx:~$
weberjoh@nb15-lx:~$ traceroute6 netsec.blog
traceroute to netsec.blog (2a01:488:42:1000:50ed:8588:8a:c570) from 2001:470:7250::b15:22, 30 hops max, 24 byte packets
 1  pa-dmz.weberlab.de (2001:470:7250::1)  1.058 ms  0.287 ms  0.181 ms
 2  router1-fa0-1.weberlab.de (2001:470:1f0b:319::1)  0.835 ms  1.234 ms  1.036 ms
 3  tunnel643592.tunnel.tserv6.fra1.ipv6.he.net (2001:470:1f0a:319::1)  14.686 ms  16.142 ms  13.943 ms
 4  * * *
 5  et-7-0-0-u100.fra1-cr-polaris.bb.gdinf.net (2001:7f8::5125:f1:1)  12.482 ms  10.207 ms  11.824 ms
 6  ae0.fra10-cr-antares.bb.gdinf.net (2a01:488:bb03:100::3)  19.943 ms  12.124 ms  11.887 ms
 7  ae2.cgn1-cr-nashira.bb.gdinf.net (2a01:488:bb02:101::2)  11.712 ms  29.159 ms  17.87 ms
 8  ae0.sr-jake.cgn1.dcn.heg.com (2a01:488:bb::223)  28.083 ms  16.166 ms  16.063 ms
 9  * * *
10  * * *
11  * * *
12  * * *
13  * * *
14  * * *
15  * * *
16  * * *
17  * * *
18  * * *
19  * * *
20  * * *
21  * * *
22  * * *
23  * * *
24  * * *
25  * * *
26  * * *
27  * * *
28  * * *
29  * * *
30  * * *

(Don’t worry about the count to 30 hops for this. The destination or a firewall somewhere there is not responding, hence it counts to infinity which is 30 for traceroute.)

But within Wireshark, it looked like this (omitting the ICMPv6 messages here). That is: Only one static UDP destination port, hence only one UDP stream as seen by Wireshark. Furthermore, a different data portion:

(Don’t worry that no packets at all are marked red (compared to the legacy IP ones), this is part of this discussion as well. It might change with Wireshark versions > 4.0.)

That’s why I did a traceroute -6, this time from another machine: Ubuntu 20.04.5 LTS (GNU/Linux 5.4.0 x86_64):

weberjoh@h2877111:~$ traceroute -V
Modern traceroute for Linux, version 2.1.0
Copyright (c) 2016  Dmitry Butskoy,   License: GPL v2 or any later
weberjoh@h2877111:~$
weberjoh@h2877111:~$ traceroute -6 netsec.blog
traceroute to netsec.blog (2a01:488:42:1000:50ed:8588:8a:c570), 30 hops max, 80 byte packets
 1  * * *
 2  491.ae12.core-b1.as6724.net (2a01:238:b:105::1)  0.285 ms  0.271 ms  0.210 ms
 3  110.ae14.bb-rt1-2.h20.r22.rs.ber.de.as6724.net (2a01:238:b:3901::1)  0.400 ms  0.343 ms 110.ae13.bb-rt1-1.e18.r23.rs.ber.de.as6724.net (2a01:238:b:3801::1)  0.537 ms
 4  ae-0-88.bb-a.ak.ber.de.oneandone.net (2001:8d8:0:3::99)  0.852 ms  0.817 ms ae-1-88.bb-a.ak.ber.de.oneandone.net (2001:8d8:0:3::a1)  0.799 ms
 5  ae-13.bb-a.tp.kae.de.net.ionos.com (2001:8d8:0:2::1d2)  14.510 ms  14.451 ms  14.365 ms
 6  ae-2.bb-b.bs.kae.de.net.ionos.com (2001:8d8:0:5::4)  16.837 ms  16.863 ms  16.871 ms
 7  ae-9.bb-b.fr7.fra.de.net.ionos.com (2001:8d8:0:2::11e)  16.884 ms  16.905 ms  16.964 ms
 8  et-7-0-0-u100.fra1-cr-polaris.bb.gdinf.net (2001:7f8::5125:f1:1)  16.417 ms  16.441 ms  16.403 ms
 9  ae0.fra10-cr-antares.bb.gdinf.net (2a01:488:bb03:100::3)  17.188 ms  17.259 ms  17.183 ms
10  ae2.cgn1-cr-nashira.bb.gdinf.net (2a01:488:bb02:101::2)  19.992 ms  19.405 ms  19.340 ms
11  ae0.sr-jake.cgn1.dcn.heg.com (2a01:488:bb::223)  59.756 ms  59.678 ms  59.631 ms
12  * * *
13  * * *
14  * * *
15  * * *
16  * * *
17  * * *
18  * * *
19  * * *
20  * * *
21  * * *
22  * * *
23  * * *
24  * * *
25  * * *
26  * * *
27  * * *
28  * * *
29  * * *
30  * * *

Which now looks more familiar compared to the traceroute for legacy IP:

TL;DR: Always use ping and/or traceroute with -6 or -4, rather than ping6/traceroute6. Or even better: use mtr.

By the way: This is what the traffic log from a Palo Alto Networks NGFW looks like for those two tools:

Anyway, those traceroutes are now within the Ultimate PCAP along with the ICMPv6/ICMP errors coming back and the DNS queries made by those traceroute tools. Thus you can investigate them by yourself. Note that those Linux traceroutes are not a protocol by themselves, hence there is no direct display filter. You can use something like this:

udp.dstport in { 33434 .. 33534 } and ( ip.ttl < 31 || ipv6.hlim < 31 )

Want to join the discussion?

Some tweets about those investigations during the last weeks:

Yeah, that happens to me when I “just want to have a short look at something”. 🤪

Photo by Nick Seagrave on Unsplash.

Who sends TCP RSTs?

$
0
0

At SharkFest’22 EU, the Annual Wireshark User and Developer Conference, I attended a beginners’ course called “Network Troubleshooting from Scratch”, taught by the great Jasper Bongertz. In the end, we had some high-level discussions concerning various things, one of them was the insight that TCP RSTs are not only sent from a server in case the port is closed, but are also commonly sent (aka spoofed) from firewalls in case a security policy denies the connection. Key question: Can you distinguish between those spoofed vs. real TCP RSTs? Initially, I thought: no, you can’t, cause the firewalls out there do a great job.

It turned out: you can!

Closed Port vs. Denying Firewall

I did a little lab for this. In a first step, I connected to one of my servers on port 21 – old-fashioned FTP. Since there was no FTP service on the server running, every connection attempt was immediately responded by a TCP RST – just as a normal Linux server behaves. The following screenshot shows five connection attempts (FileZilla) for IPv6 and five more for legacy IP, all with a RST answer from the real server:

In a second step, I configured my Palo Alto Networks firewall to block outgoing FTP connections and to respond with a RST to the client. This is common in internal environments, where you want your clients to have some sort of immediate feedback in case of blocked/closed connections. A silent drop from the firewall would result in a client application waiting for a timeout.

This screenshot shows the TCP RST that was perfectly spoofed and sent by the firewall:

If you swap between those two screenshots, you won’t see any obvious differences, don’t you? In fact, the source IP addresses (regardless of IPv6 or legacy IP) are spoofed by the firewall as if they were the real server. Good job.

How to distinguish between them???

We just proved that the packets look exactly the same, right? This is where Jasper gave a little hint at his session:

Firewalls are always sending their spoofed RSTs with a hop limit / TTL of their own, not with the exact one from the real server.

A picture is worth a thousand words:

Let’s have a look at some pings via IPv6 and legacy IP, especially on the hop limit / TTL of the returning packets which reveal the hop count of the returning route. For this, I added a custom column to Wireshark which displays the ipv6.hlim or ip.ttl:

That is: the returning IPv6 route is probably 10 hops away (since the remaining hop limit is 54, assuming the starting hop limit was 64), and the returning legacy IP route is probably 11 hops long.

Now let’s look at the RSTs again, focussing on the hop limit / TTL. This screenshot shows the 2x RSTs from the real server and 2x RSTs from the firewall:

Ha, I got you!

While the first two RSTs from the real server had a hop limit / TTL from 54 respectively 53, just as the real returning routes for the pings had as well, the spoofed RSTs from the firewall had values of 127 and 63, which is like some default starting values (128 or 64) minus one. It’s definitely not the hop limits the real server would have sent. Yep.

Q.E.D.

If you want to have a look at the captures by yourself, here we go: (They are in the Ultimate PCAP as well.)

Excursion: Palo Alto NGFW Policy Actions

I used a PA-220 with PAN-OS 10.2.1 for these tests. It was a little tricky to set the policies right for this. At first, blocking the application “ftp” did not work since the application detection of PAN will almost always let the first packets pass until it really detects the application. This is normal behaviour if you have other policies (further down) that are merely application based. My “FTP app deny” rule did not hit because the first SYN packet will flow through anyway, while the server is not responding (aka sending a RST), hence the PAN will log those connection attempts as “incomplete”:

That is: I used a port-based policy with TCP destination port 21 to block those connection attempts instantly. Now it was about selecting the correct type of “block” to have the firewall send TCP RSTs. The commonly used “Deny” did indeed block the connections, but did not respond with RSTs. (You will find those attempts in the pcap as well.) A “Drop“, even with an enabled “Send ICMP Unreachable” did not send back any RSTs as well, though the documentation states this. Finally, the “Reset client” did the trick. I also selected the “Send ICMP Unreachable” here, but I think it would have worked without it.

Here are the traffic logs during my tests:

  1. allowing FTP but the server sent a TCP RST
  2. action “deny”, that is: silently drop in this case
  3. action “drop” with sending ICMP unreach: silently dropping as well
  4. action “reset client” with sending ICMP unreach again. For whatever reason Palo does not highlight this policy action as red, which is a GUI bug in my point of view.

Appendix: What about UDP? –> ICMP

When it comes to UDP connections, there is no concept like a RST from the server within the same UDP session. (Remember: UDP is stateless.) Instead, the server is sending an ICMP port unreachable messages back to the client. Arrows 1 and 2 on the following screenshot. Note that the custom column in Wireshark displays two hop limits since the received ICMP packets (with their hop limits) embed the original packets that forced the error (with their own hop limits as seen by the server).

Talking about the Palo Alto Networks NGFW, it does *not* spoof the ICMP port unreachables, but sends ICMP administratively prohibited messages, clearly telling the client that there is a firewall in between. Those packets are sourced from the actual firewall IP addresses, arrows 3 and 4. Consistently, those ICMP packets have the hop limit / TTL from the egress interface, arrows 5 and 6:

BUT a BUG: Did you spot it? The Palo has an obvious bug, as it sends the ICMPv6 packets from the unspecified IPv6 of “::”. This definitely violates the standards. Nobody is perfect. ;) I opened a ticket and reported it, though I’m not expecting that they’ll fix it.

Photo by Kelly Sikkema on Unsplash.

RADIUS & TACACS+ PCAP

$
0
0

Again two more commonly used network protocols for the Ultimate PCAP: the Remote Authentication Dial-In User Service (RADIUS) and the Terminal Access Controller Access-Control System Plus (TACACS+) protocols. Captured with quite some details:

You can either download the Ultimate PCAP (recommended ;)) or merely these PCAPs:

RADIUS

Quoting Wikipedia: “Remote Authentication Dial-In User Service (RADIUS) is a networking protocol that provides centralized authentication, authorization, and accounting (AAA) management for users who connect and use a network service. […] The RADIUS server checks that the information is correct using authentication schemes such as PAP, CHAP or EAP.”

For these tests, I installed FreeRADIUS version 3.0.20 on a Ubuntu 20.04.5 LTS (5.4.0-135-generic x86_64).

At first, I used the “radtest” tool for some very basic query-responses aka request-accept messages. IPv6 and legacy IP, each time with: PAP, CHAP, and MS-CHAP:

weberjoh@vm30-test1:~$ radtest -t pap -6 bob ThisIsThePassword test2-v6.weberlab.de 10 iNJ72r0uPXP5qhAX Sent Access-Request Id 238 from [::]:51580 to [2001:470:1f0b:16b0:20c:29ff:fea8:26f7]:1812 length 101
        User-Name = "bob"
        User-Password = "ThisIsThePassword"
        NAS-IPv6-Address = ::1
        NAS-Port = 10
        Message-Authenticator = 0x00
        Cleartext-Password = "ThisIsThePassword"
Received Access-Accept Id 238 from [2001:470:1f0b:16b0:20c:29ff:fea8:26f7]:1812 to [::]:0 length 32
        Reply-Message = "Hello, bob"
weberjoh@vm30-test1:~$ radtest -t chap -6 bob ThisIsThePassword test2-v6.weberlab.de 10 iNJ72r0uPXP5qhAX
Sent Access-Request Id 23 from [::]:46192 to [2001:470:1f0b:16b0:20c:29ff:fea8:26f7]:1812 length 86
        User-Name = "bob"
        CHAP-Password = 0xea8d36b4906c71784c75e17983e36cab66
        NAS-IPv6-Address = ::1
        NAS-Port = 10
        Message-Authenticator = 0x00
        Cleartext-Password = "ThisIsThePassword"
Received Access-Accept Id 23 from [2001:470:1f0b:16b0:20c:29ff:fea8:26f7]:1812 to [::]:0 length 32
        Reply-Message = "Hello, bob"
weberjoh@vm30-test1:~$ radtest -t mschap -6 bob ThisIsThePassword test2-v6.weberlab.de 10 iNJ72r0uPXP5qhAX
Sent Access-Request Id 22 from [::]:60664 to [2001:470:1f0b:16b0:20c:29ff:fea8:26f7]:1812 length 141
        User-Name = "bob"
        MS-CHAP-Password = "ThisIsThePassword"
        NAS-IPv6-Address = ::1
        NAS-Port = 10
        Message-Authenticator = 0x00
        Cleartext-Password = "ThisIsThePassword"
        MS-CHAP-Challenge = 0x9cfe6e183debe56d
        MS-CHAP-Response = 0x0001000000000000000000000000000000000000000000000000517e32e81fc99c2d05fc072ce33afe6eb5a01a782532c359
Received Access-Accept Id 22 from [2001:470:1f0b:16b0:20c:29ff:fea8:26f7]:1812 to [::]:0 length 96
        Reply-Message = "Hello, bob"
        MS-CHAP-MPPE-Keys = 0x00000000000000001c2e158974b065d412b4456d6ebf7574
        MS-MPPE-Encryption-Policy = Encryption-Allowed
        MS-MPPE-Encryption-Types = RC4-40or128-bit-Allowed
weberjoh@vm30-test1:~$
weberjoh@vm30-test1:~$ radtest -t pap bob ThisIsThePassword test2-v4.weberlab.de 10 iNJ72r0uPXP5qhAX    Sent Access-Request Id 19 from 0.0.0.0:35337 to 194.247.5.27:1812 length 89
        User-Name = "bob"
        User-Password = "ThisIsThePassword"
        NAS-IP-Address = 127.0.0.1
        NAS-Port = 10
        Message-Authenticator = 0x00
        Cleartext-Password = "ThisIsThePassword"
Received Access-Accept Id 19 from 194.247.5.27:1812 to 0.0.0.0:0 length 32
        Reply-Message = "Hello, bob"
weberjoh@vm30-test1:~$ radtest -t chap bob ThisIsThePassword test2-v4.weberlab.de 10 iNJ72r0uPXP5qhAX
Sent Access-Request Id 52 from 0.0.0.0:41381 to 194.247.5.27:1812 length 74
        User-Name = "bob"
        CHAP-Password = 0xe58f51cf7e8b048d3d8ebbf5837378e277
        NAS-IP-Address = 127.0.0.1
        NAS-Port = 10
        Message-Authenticator = 0x00
        Cleartext-Password = "ThisIsThePassword"
Received Access-Accept Id 52 from 194.247.5.27:1812 to 0.0.0.0:0 length 32
        Reply-Message = "Hello, bob"
weberjoh@vm30-test1:~$ radtest -t mschap bob ThisIsThePassword test2-v4.weberlab.de 10 iNJ72r0uPXP5qhAX
Sent Access-Request Id 102 from 0.0.0.0:43642 to 194.247.5.27:1812 length 129
        User-Name = "bob"
        MS-CHAP-Password = "ThisIsThePassword"
        NAS-IP-Address = 127.0.0.1
        NAS-Port = 10
        Message-Authenticator = 0x00
        Cleartext-Password = "ThisIsThePassword"
        MS-CHAP-Challenge = 0x336bbd41fe6c4c2d
        MS-CHAP-Response = 0x00010000000000000000000000000000000000000000000000004ec1a471e0992133be0bed6a714beffd62802495e0e34a5f
Received Access-Accept Id 102 from 194.247.5.27:1812 to 0.0.0.0:0 length 96
        Reply-Message = "Hello, bob"
        MS-CHAP-MPPE-Keys = 0x00000000000000001c2e158974b065d412b4456d6ebf7574
        MS-MPPE-Encryption-Policy = Encryption-Allowed
        MS-MPPE-Encryption-Types = RC4-40or128-bit-Allowed

Secondly, I did some “Test User Credentials” on a Fortinet FortiWiFi FWF-61E with FortiOS 7.0.9 within the RADIUS Servers profile. I did the following methods in that order: PAP, CHAP, MS-CHAP, and MS-CHAP-v2. The FortiGate is not capable of any secure authentication schemes nor communicating via IPv6. (Why is this called a next-gen firewall?)

Thirdly I did some authentication tests on a Palo Alto Networks PA-220 with PAN-OS 10.2.3. I wanted to test some advanced authentication variants of RADIUS that are secured by TLS. Therefore, I ran the “/etc/freeradius/3.0/certs/bootstrap” script on the FreeRADIUS server to get some certificates in place, edited some config files (I don’t remember which one exactly, but in the end, it worked – hahaha), exported the snakeoil root CA, imported it into the Palo Alto NGFW, marked it as “Trusted Root CA”, created an appropriate Certificate Profile, and selected this profile within the RADIUS server profile. (This would be an own blog post just about using secure RADIUS with the PAN. ;)) In the end, I was able to test the following auth protocols: PEAP-MSCHAPv2, PEAP with GTC, and EAP-TTLS with PAP. I did this by selecting the respective method, followed by the useful “test authentication […]” CLI commands. No commit needed to test all those stuff, though freshly configured within the GUI. Great.

This was the output during the tests on the PAN CLI:

weberjoh@pa> test authentication authentication-profile test2 username bob password
Enter password :

Target vsys is not specified, user "bob" is assumed to be configured with a shared auth profile.

Do allow list check before sending out authentication request...
name "bob" is in group "all"

Egress: No service source route is set, might use destination source route if configured
Test authentication to RADIUS server 2001:470:1f0b:16b0:20c:29ff:fea8:26f7:1812 for user: "bob" (with anonymous outer id) using protocol: PEAP with MSCHAPv2
Successful EAPOL auth.
Authentication succeeded against RADIUS server at 2001:470:1f0b:16b0:20c:29ff:fea8:26f7:1812 for user "bob"


Authentication succeeded for user "bob"

weberjoh@pa>
weberjoh@pa>
weberjoh@pa> test authentication authentication-profile test2 username bob password
Enter password :

Target vsys is not specified, user "bob" is assumed to be configured with a shared auth profile.

Do allow list check before sending out authentication request...
name "bob" is in group "all"

Egress: No service source route is set, might use destination source route if configured
Test authentication to RADIUS server 2001:470:1f0b:16b0:20c:29ff:fea8:26f7:1812 for user: "bob" (with anonymous outer id) using protocol: PEAP with GTC
Successful EAPOL auth.
Authentication succeeded against RADIUS server at 2001:470:1f0b:16b0:20c:29ff:fea8:26f7:1812 for user "bob"


Authentication succeeded for user "bob"

weberjoh@pa>
weberjoh@pa>
weberjoh@pa> test authentication authentication-profile test2 username bob password
Enter password :

Target vsys is not specified, user "bob" is assumed to be configured with a shared auth profile.

Do allow list check before sending out authentication request...
name "bob" is in group "all"

Egress: No service source route is set, might use destination source route if configured
Test authentication to RADIUS server 2001:470:1f0b:16b0:20c:29ff:fea8:26f7:1812 for user: "bob" (with anonymous outer id) using protocol: EAP-TTLS with PAP
Successful EAPOL auth.
Authentication succeeded against RADIUS server at 2001:470:1f0b:16b0:20c:29ff:fea8:26f7:1812 for user "bob"


Authentication succeeded for user "bob"

weberjoh@pa>

And since I ran the FreeRADIUS server in debug mode, I’ll hand out those debug logs as well, just in case you’re interested. 3320 lines for those 3x auth tests. Wow. ;) Click here to download it.

Wiresharking

For all these tests I used the same RADIUS shared secret of iNJ72r0uPXP5qhAX. Paste it into the Edit -> Preferences -> Protocols -> RADIUS section to have Wireshark decrypt some stuff:

And now, some Wireshark screenshots, while I strongly encourage you to download the Ultimate PCAP and click around it by yourself. Use the display filter of radius.

I’ve only used some basic AVPs here since I did not use RADIUS in production with several different vendors and stuff. However, you get the idea. And there are already enough fields to dig into. ;) Furthermore, I only used RADIUS with UDP (not sure whether TCP is used at all for RADIUS?) and only for authentication on port 1812, not accounting on port 1813. I also missed mistyping the user password to have a reject. Yeah, that’s the way it is.

TACACS+

To simply state the TACACS article on Wikipedia again: “TACACS+ is a Cisco designed extension to TACACS that encrypts the full content of each packet. Moreover, it provides granular control in the form of command-by-command authorization. […] TACACS+ encrypts all the information mentioned above and therefore does not have the vulnerabilities present in the RADIUS protocol.”

TACACS+ uses TCP as transport and has its well-known port of 49. For my lab, I used an Aruba ClearPass Policy Manager version 6.9.10.134806 as the server and a Cisco ASR1001-X with IOS XE Version 17.03.04a as the client aka NAS. (I apologise for being IPv4-only this time…)

Fortunately, Wireshark is able to decrypt all TACACS+ messages in case the shared secret is provided, which is true for my lab: John3.16. Edit -> Preferences -> Protocols -> TACACS+:

As always, if you want to see the whole TCP sessions aka streams (incl. the three-way handshakes), you have to use a display filter like tcp.port eq 49. The display filter for only the payload of TACACS+ (with the plus) is tacplus. (For the predecessor, which is TACACS without the plus, it is tacacs. But this is not used here.) I did the following steps during the capturing:

  • 2x login with a wrong password -> authentication failed
  • correct login -> authentication passed
  • some CLI commands on the router to have a –> authorization
  • and out of the box for TACACS+ –> accounting

That’s it for now. Merry Christmas! 🎄

Photo by CardMapr.nl on Unsplash.

Palo Alto: Instant Commit

$
0
0

Finally! With PAN-OS 11.0 Palo Alto Networks introduced an “instant commit”. That is: You no longer have to commit (and wait and wait and wait) until your changes are live, but everything you do is IMMEDIATELY active. Just as on any other firewall, e.g., the Fortis.

Here is how you can enable it along with some use cases and drawbacks:

Enabling this new feature is quite simple: It’s under Device -> Setup -> General Settings:

After that, you must make one more final commit until everything happens instantly.

To my mind, the biggest advantage of this is when testing new security policies and profiles. You no longer have to wait for the next commit until you see that it’s still not working. ;) Other changes that benefit from this are:

  • NAT stuff
  • routing protocol options to become neighbours
  • user identification agents
  • server profile settings such as RADIUS or syslog

However, there are situations where this is not advantageous though. That is: where the normal commit (that activates several changes at once) still has its charm:

  • setting a new IP address of the untrust interface along with its default route
  • changing IPsec tunnel parameters along with PSK and routes
  • changing routes along with exit interfaces and appropriate security zones in policies

Of course, you can always disable this option again for some time.

Note that PAN-OS 11.0 is not available on all current hardware platforms. Especially, it is not available on the PA-220. :( I tested it on a PA-820 cluster.

Happy configuring. ;)

Photo by eniko kis on Unsplash.

Stateful DHCPv6 Capture (along with Relaying)

$
0
0

For my IPv6 training classes, I was missing a capture of a stateful DHCPv6 address assignment. That is: M-flag within the RA, followed by DHCPv6 messages handing out an IPv6 address among others. Therefore, I set up a DHCPv6 server on an Infoblox grid and furthermore used a Palo Alto NGFW as a DHCPv6 relay to it. I captured on two points: from the client’s point of view (getting to the relay) and from the server’s point of view (unicast messages from the relay). And since I was already there anyway, I additionally captured the same process for DHCPv4. So, here we go:

Basic Setup

A picture is worth a thousand words:

Yep, it’s getting a little complicated with all these addresses. ;)

Capture Details

First, you can download these captures here. I did not join those two capture files on purpose, since it’s much easier to open them side by side this way.

However, it’s in the Ultimate PCAP as well, of course. :)

Note the differences within the IP addresses and UDP ports (both, IPv6 and legacy IP) with regard to the capturing points:
  1. At the client’s broadcast domain: multicast via link-local (fe80::…) / All_DHCP_Relay_Agents_and_Servers (ff02::1:2) for IPv6 while broadcast for IPv4
  2. At the server’s segment: unicast with GUAs for IPv6 and unicast for IPv4

On the client side, I captured with my ProfiShark. (VLAN 69 tagged since I captured right at the firewall but before the ESXi.) On the server side, I used the built-in “Traffic Capture” feature of the Infoblox Grid. Hence a “Linux cooked capture” encapsulation rather than a classical Ethernet frame. Simply ignore it. More details concerning legacy IP DHCPv4 sequences can be found here.

Here are some Wireshark screenshots. On the left-hand side the client’s perspective and on the right-hand side the server’s perspective. Please note the packet comments that I added to all those messages (and displayed them as a column as well). Likewise, note the differences in the Info column. First, IPv6:

Second, legacy IP:

One major difference between DHCP and DHCPv6: While the default gateway is sent for legacy IP within the DHCP messages, it is NOT sent for IPv6 via DHCPv6, since the IPv6 host already knows its default gateway via the router advertisement.

Another difference: While DHCP for legacy IP always embeds the client’s MAC address, DHCPv6 does not. It uses the concept of a “DHCP Unique Identifier (DUID)” which can be made out of different options.

My Ubuntu 20.04.5 LTS (GNU/Linux 5.4.0-144-generic x86_64) VM did release the IPv4 address upon shutdown, but not the IPv6 address. That’s why you can only see this single v4 release, sent by the client *directly* to the DHCP server, not via the relay. Hence this captured message is exactly the same in both capture files.

Detailed Setup

DHCPv6 Server on the Infoblox

Using NIOS version 9.0.0. DHCPv4 is as always. Let’s have a look at DHCPv6.

At first some Grid DHCP Properties. Note that the “Domain Name” is not working as expected with regards to DHCPv4 (at least with my Ubuntu clients). It is used for DDNS within the Infoblox DDI. To have a DNS search list on your client, you have to use the custom option 24 “dhcp6.domain-search”. While the SNTP servers option is working, I was *not* able to get the NTP option running. This would be option 56, which is not yet implemented in NIOS. (Why?!? Some discussion here.) Finally, note that you do NOT have a “default router” option with DHCPv6 at all, since the default router always propagates itself using router advertisements on the local link!

I added one IPv6 DHCP Range within a /64 network:

Don’t forget to activate IPv6 on the appropriate members. (So did I… ;))

After some IPv6 addresses were handed out by the (stateful) DHCPv6 server, you can find them on the Active Leases page. Note the DUID for DHCPv6 rather than the mere MAC address for DHCPv4:

Relaying on the Palo

I’m using a PA-220 with PAN-OS 10.2.3 here in my lab. Quite simple: Network -> DHCP -> DHCP Relay -> adding the interface, activating the Internet Procols you want to use (in my case: both) and add the actual DHCP(v6) server addresses:

And don’t forget an appropriate policy allowing DHCP(v6) from this originating zone to the destination zone with the actual servers, such as:

Some, but not all (!) DHCP and DHCPv6 sessions are seen by the traffic log. The multicast (v6) respectively broadcast (v4) messages are not logged, but for v6 the unicast (relay) and link-local packets, while for v4 the unicast relay and the final release are:

That’s it. Happy troubleshooting. :D

Photo by Arno Senoner on Unsplash.


Palo Alto NGFW: Handling of IPv6 on the Interface

$
0
0

For the last few years, I have been confused about Palo Alto NGFWs’ various options for configuring an IPv6 address on a layer 3 interface. Let’s have a look at some details:

I’m using a PA-220 with PAN-OS 10.2.4-h2.

My Defaults

Normally, I’m enabling IPv6 on the interface (of course), leaving the Interface ID as “EUI-64”, adding a single GUI IPv6 address along with “Send RA” with its default values, while leaving the Duplicate Address Detection (DAD) unchecked (since it’s a firewall and you definitely want its address to be online) but enabling the NDP monitoring. I “Enable Router Advertisement” in general for this interface and include DNS information within the RAs. This looks like follows:

A show interface <interface name> shows the interface IPv6 addresses (link-local based on EUI-64 as well as the just configured global unicast) along with the advertised prefix:

weberjoh@pa> show interface ethernet1/8.21

--------------------------------------------------------------------------------
Name: ethernet1/8.21, ID: 257, 802.1q tag: 21
Operation mode: layer3
Virtual router default
Interface MTU 1500
Interface IP address: 192.168.21.1/24
Interface IPv6 address: fe80::286:9cff:fee7:5517/64
  2a00:6020:5004:2621::1/64
DAD: disabled
NDP Monitoring: enabled
IPv6 Client Mode: disabled
Router Advertisement: enabled
  Advertised IPv6 prefix:
    2a00:6020:5004:2621::1/64
DNS Support: enabled
  DNS Server(s):
    2a00:6020:5004:2600:1e69:7aff:fe0f:cc5e
  DNS Suffix(es):
    weberlab.de
[...]

Use interface ID as host portion

So far, so good. But I was confused about this “Use interface ID as host portion” option, which I enabled on another (sub)interface on the Palo for testing purposes:

For whatever reason, this option is named “Prefix” in the overview, which actually confused me even more:

In the end, this simply ignored the manually configured host portion of the IPv6 address and used the “Interface ID” option from the (sub)interface (which defaults to EUI-64) as the host portion. Hence the name. ;) The advertised prefix (line 16) still uses the manually configured IPv6 address rather than the one with the interface ID option:

weberjoh@pa> show interface ethernet1/8.22

--------------------------------------------------------------------------------
Name: ethernet1/8.22, ID: 259, 802.1q tag: 22
Operation mode: layer3
Virtual router default
Interface MTU 1500
Interface IP address: 192.168.22.1/24
Interface IPv6 address: fe80::286:9cff:fee7:5517/64
  2a00:6020:5004:2622:286:9cff:fee7:5517/64
DAD: disabled
NDP Monitoring: enabled
IPv6 Client Mode: disabled
Router Advertisement: enabled
  Advertised IPv6 prefix:
    2a00:6020:5004:2622::1/64
DNS Support: enabled
  DNS Server(s):
    2a00:6020:5004:2600:1e69:7aff:fe0f:cc5e
  DNS Suffix(es):
    weberlab.de

I have no clue why someone explicitly wants the host portion to be the EUI-64 one. Do you have any ideas, other than cosmetic? Maybe to have the same host portion for the link-local and the global unicast addresses? While the router advertisements are sent from the link-local address anyway. 🤷

Anycast?!?

To be honest, I don’t have any idea what this “Anycast” checkmark is all about at the IPv6 address configuration here. The doc states “Select to include routing through the nearest node.” Eh? Will this add this router address into some routing protocols as an additional host route? Any ideas someone?

Prefix Information

One more thing I noticed: The prefix information options within the ICMPv6 Router Advertisements are sent with the manually configured IPv6 address in both scenarios. That is: It is sent with the actual *address* of the router’s interface rather than the mere /64 prefix. While this is perfectly valid as of RFC 4861 (“An IP address or a prefix of an IP address.”), I personally prefer having the /64 prefix without a filled-in host portion in the RAs. Here are screenshots with the RAs from both interfaces I tested with. Wireshark decodes it as “Prefix”, which is not 100 % correct at this time (though unambiguous to my mind; no change required):

Photo by Thiago Palia on Unsplash.

Minor Palo Bug: ICMPv6 Errors sourced from Unspecified Address

$
0
0

During my IPv6 classes, I discovered a (minor) bug at the NGFW from Palo Alto Networks: ICMPv6 error messages, such as “time exceeded” (type 3) as a reply of traceroute, or “destination unreachable” (type 1) as a reply of a drop policy, are not correctly sourced from the IPv6 address of the data interface itself, but from the unspecified address “::”. Here are some details:

Tested environments: PA-220 with PAN-OS 10.2.4-h2 and 10.2.5, as well as PA-440 with PAN-OS 11.0.2-h2.

The Bug

I basically stumbled upon this problem as I played around with some traceroutes:

weberjoh@nb15-lx:~$ traceroute -6 lx2.weberlab.de
traceroute to lx2.weberlab.de (2001:470:1f0b:16b0::a36:22), 30 hops max, 80 byte packets
 1  :: (::)  1.095 ms  0.763 ms  0.755 ms
 2  * * *
 3  * * *
 4  * * *
 5  port-channel12.core2.fra1.he.net (2001:470:0:63d::1)  3.155 ms  3.590 ms *
 6  tserv1.fra1.he.net (2001:470:0:69::2)  46.521 ms  49.557 ms  52.595 ms
 7  tunnel525322-pt.tunnel.tserv6.fra1.ipv6.he.net (2001:470:1f0a:16b0::2)  124.070 ms  122.339 ms  121.901 ms
 8  2001:470:1f0b:16b0::a36:22 (2001:470:1f0b:16b0::a36:22)  80.968 ms  77.495 ms  74.469 ms

In Wireshark, this looks as follows:

Later on, I discovered the same behaviour when a security policy’s action is set to “Drop” along with “Send ICMP Unreachable”, e.g. here:

This looks as follows in Wireshark (different ICMPv6 type, but the same wrong address):

The source address of “::” as sent from the Palo is incorrect.

RFC 4443 “Internet Control Message Protocol (ICMPv6) for the Internet Protocol Version 6 (IPv6) Specification” defines how the source address of an originating ICMPv6 packet MUST look like:

[…] the Source Address of the ICMPv6 packet MUST be a unicast address belonging to the node.

The very only case, in which an IPv6 packet is sent from the unspecified address, is the Duplicate Address Detection process and its corresponding Neighbour Solicitation. (RFC 4861 and RFC 4291.)

Two more notes:

  1. This only happens with IPv6. For legacy IP, the correct data interface IPv4 address is chosen as the source address.
  2. This only appears on VLAN interfaces, but not on “normal” Layer 3 interfaces. <- This is interesting because some years ago I found another IPv6 bug which was related to a VLAN interface as well. To me, this seems like the IPv6 routines for different types of interfaces on PAN-OS are not exactly the same.

On a mere Layer 3 interfaces those ICMPv6 packets are sourced correctly:

PAN Ticket -> Bug

In October 2022, I created a ticket at the PAN support, telling them about this bug. Luckily, I was able to convince the ticket owner that this has to be fixed since it is clearly a violation of the Internet standards. (To be fair, I also told them that I don’t believe that this is a big thing nor security-related.) The bug got the bug ID PAN-214336. After some months, I got an update from the engineering team, saying that this should be fixed with PAN-OS 10.2.5. Unfortunately, this wasn’t the case. Neither is this bug listed in the release notes nor is it actually fixed with PAN-OS 10.2.5, as I tested it again. Furthermore, it is present in the PAN-OS 11.x major versions as well.

Hopefully, it will get fixed someday. At least, you guys can google it now. :)

Soli Deo Gloria.

Photo by Valeriy Borzov on Unsplash.

DHCPv6 Prefix Delegation on Palo Alto’s NGFW

$
0
0

Finally! With PAN-OS 11.0 a long missing IPv6 feature was introduced: DHCPv6-PD aka prefix delegation. For the first time, we can now operate a PAN-OS firewall directly on the Internet (the IPv6-Internet that is) on many kinds of ISP connections. Remember: To get a routed IPv6 prefix requires DHCPv6-PD (if you’re not a BGP-homed enterprise). Hence, without that feature, we could not connect to the Internet with a Palo directly.

With DHCPv6-PD, the firewall can receive a prefix from the ISP (commonly a /48 or a /56), while handing out /64s to downstream layer 3 interfaces. Here we go:

Please refer to my previous blog post about DHCPv6 prefix delegation in detail.

My Setup

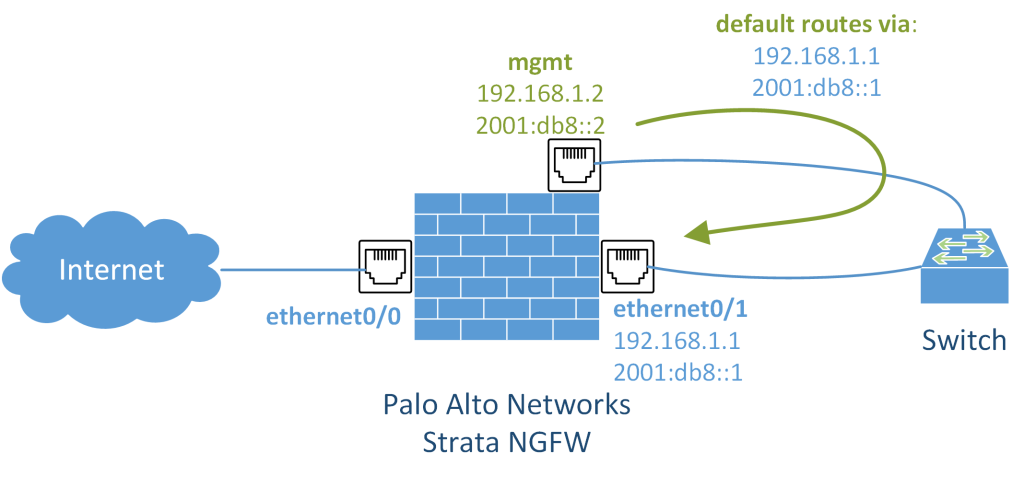
I’m sitting behind a fibre ISP connection from Deutsche Glasfaser. The ethernet1/1 interface is directly attached to the fibre modem. I’m referring to it as my “WAN interface”. (More details about the connection establishment are available in German.) I’m using a PA-440 with PAN-OS 11.1.1. The client-facing interfaces ethernet1/3.24 and ethernet1/7 shall hand out /64 prefixes via RAs.

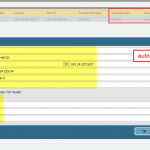
Configuration of the WAN Interface

At first, the WAN interface (ethernet1/1 in my case) is enabled for IPv6 with the type “DHCPv6 Client”. In my scenario, I set the request type to “Non-Temporary Address” only. In the second step, the prefix delegation is enabled (with a prefix length hint of 48 – just because I can) and a name for the pool:

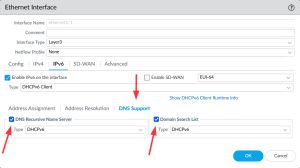
I enabled DAD (Duplicate Address Detection) on the WAN interface (the best practice for firewall interfaces is to NOT activate it, but to be IPv6-compliant facing the ISP I would recommend it), enabled NDP monitoring, and enabled the DNS recursive name server and domain search list via DHCPv6 as well to get that information via DHCPv6:

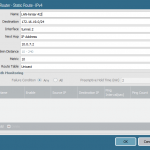
Configuration of Host-Facing Interfaces

To let the Palo assign a /64 per host-facing interface, you have to enable IPv6 with the type “Inherited” and add a “GUA from Pool”. This is the pool you’ve created in step 2 above.

The assignment type can be “Dynamic” or “Dynamic with Identifier“. Note that you can’t mix those types within a single prefix pool. That is: you must either use dynamic on *all* host-facing interfaces, or dynamic with identifier again on *all* host-facing interfaces.

Since I wanted to test static subnet-IDs, I chose “dynamic with identifier”. Note that the identifier is a number from 0-4095 (decimal) converted to hexadecimal for the last three characters in the fourth hextet. (That is: This process on the NGFW is meant to deal with /52 prefixes turned into /64. Can’t we use /48 prefixes?!? This would require a range from 0-65535. Or even better: Why can’t we just type in hexadecimal values? That doesn’t seem to me to be fully developed here.)

Example: If your ISP-assigned prefix via DHCPv6-PD is 2001:db8:2311:a300::/56, choosing an identifier of 15 (decimal) will convert to an f (hex) and will end in the following host-facing prefix: 2001:db8:2311:a30f::/64. Since I wanted to see a 24 as the subnet-ID to follow my VLAN, I chose an identifier of 36. The name of this “Assign Addr” portion is not relevant at all.

Address resolution and router advertisement as always (no M nor O flag in my lab):

On my first host-facing interface, ethernet1/3.24, I set the DNS support to manual to use statically configured recursive DNS servers and my own search list. (I’m using Google’s public DNS64 servers here since this subnet is IPv6-only with NAT64. More on this in upcoming blog posts.) On another subnet, ethernet1/7, I chose the DHCPv6 type as the recursive DNS server to use the ISP-provided recursive DNS server which came in via DHCPv6, while I did not want to use the provided DNS search list in my lab, hence I left it unchecked:

Further Less reading from PANW: DHCPv6 Client with Prefix Delegation.

Show It To Me Baby! (uh huh, uh huh)

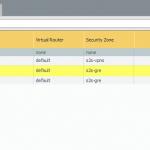
Within the well-known Network -> Interfaces -> Ethernet view you can click on “Dynamic-DHCPv6 Client” for information about the WAN interface and on “IPv6-Inherited” for the host-facing interfaces:

Let’s start with the WAN interface. This “DHCPv6 Client Runtime Info” lists the client (1) and server (2) DHCPv6 information aka DUID, the IPv6 address of the interface itself (3) with its default gateway (4), along with the recursive DNS servers (5). Finally, the IPv6 prefix (6) which is why we are all here:

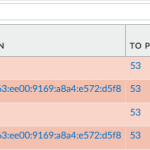
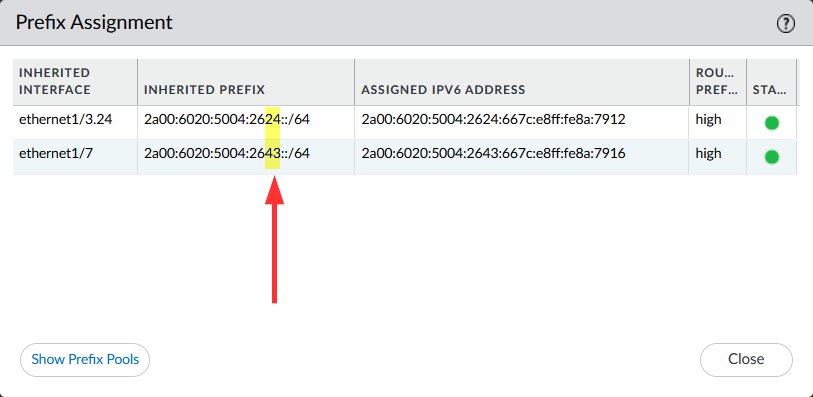
A further click on “Show Prefix Pool Assignment” lists all the dynamically assigned /64 prefixes to downstream interfaces, in my case those two configured layer 3 interfaces. Note the last two hex values aka subnet-IDs of 24 (configured as decimal 36) and 43 (configured as decimal 67):

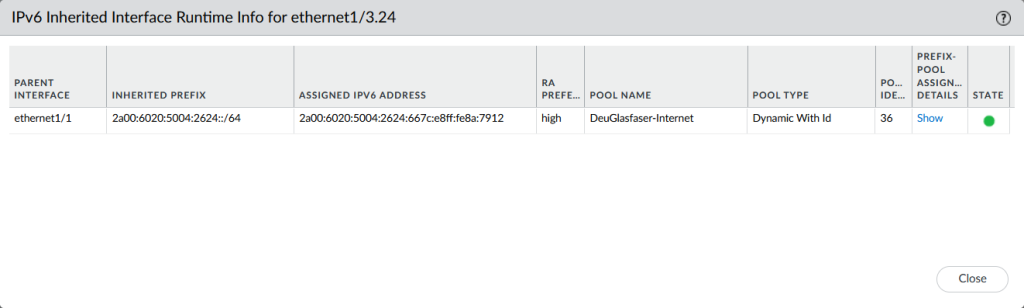
The “IPv6-Inherited” on a host-facing interface, in my case ethernet1/3.24, shows the parent interface (eth1/1), the inherited prefix, and so on:

Command Line Interface

On the CLI you can use several commands for further troubleshooting. (Remember that you can find commands with something like this: find command keyword dhcpv6)

For example:

show dhcp client ipv6 pool-details all
show dhcp client ipv6 state interface ethernet1/1
debug dhcpd show objects

That is:

weberjoh@pa> show dhcp client ipv6 pool-details all

Pool Name: DeuGlasfaser-Internet
Prefix: 2a00:6020:5004:2600::/56
Requesting Interface: ethernet1/1
Remaining Lease Time: 0 days 0:45:32
Preferred Lifetime (sec): 3600
Valid Lifetime (sec): 3600
IAID: 19010010
DUID: 00010001262c4077005056b18ad7
State: active
Delegated Interface(s):
 ethernet1/3.24
 ethernet1/7
Address Assignment(s):
  ethernet1/3.24   2a00:6020:5004:2624:667c:e8ff:fe8a:7912
  ethernet1/7      2a00:6020:5004:2643:667c:e8ff:fe8a:7916


weberjoh@pa>
weberjoh@pa> show dhcp client ipv6 state interface ethernet1/1

DHCPv6 Details:
  Interface: ethernet1/1
  Rapid Commit: Enabled
  State: BOUND
  Client:
    Address: fe80::667c:e8ff:fe8a:7910
    DUID: 000100012d86be01647ce88a7910 (Type: LLT)
  Server:
    Address: fe80::ff:fe01:101
    DUID: 00010001262c4077005056b18ad7
    Preference: 0
  Gateway: fe80::ff:fe01:101
  Remaining lease time: 0 days 0:42:41
  IPv6 Address (IA_NA):
    Address: 2a00:6020:1000:40::436
    Preferred Lifetime (sec): 3600
    Valid Lifetime (sec): 3600
  IPv6 Address (IA_TA):
  Delegated Prefix:
    IAID: 19010010
    IPv6 Prefix (IA_PD):
      Prefix: 2a00:6020:5004:2600::/56
      Preferred Lifetime (sec): 3600
      Valid Lifetime (sec): 3600
  DNS Server:
    2a00:6020:100::1
    2a00:6020:200::1
  DNS Suffix:

Counters:
  DHCPv6 control packets received: 10
  DHCPv6 control packets sent: 11
  RA control packets received: 20
  RS control packets sent: 1


weberjoh@pa>
weberjoh@pa> debug dhcpd show objects

--------------DHCP CFG OBJS---------------
CFG obj itf name: ethernet1/1 (0x7f9858088440)

--------------DHCP RT OBJS---------------
RT obj name: ethernet1/1 (0x7f9860007160)
  obj addr:0x7f9860007160
  enabled:1
  create def route:1
  def route metric:10
  server mac: 02:00:00:01:01:01
  Retry number:0
  Elapsed seconds:1583
  State:Bound

--------------DHCPV6 CFG OBJS---------------
CFG obj itf name: ethernet1/1 (0x7f9858089c00)

--------------DHCPV6 RT OBJS---------------
DHCPv6 client: ethernet1/1, if_index: 16, rt: 0x7f9864007160
General:
  vr_id: 1, b_enabled: 1
  pointer address             : 0x7f9864007160
  IP Address                  : 2a00:6020:1000:40:0:0:0:436
  Server ID                   : 0:0:0:0:0:0:0:0
  Link local Addr             : fe80:0:0:0:667c:e8ff:fe8a:7910
  Gateway                     : fe80:0:0:0:0:ff:fe01:101
  Trans ID                    : 0xf6f3bd
  Client DUID                 : 000100012d86be01647ce88a7910 (length: 14, duid_type: LLT)
SLAAC Data:
  opaque_data: 0x7f9864007160, ifindex: 16, name: ethernet1/1, mac: 64:7c:e8:8a:79:10
  autoconfig: disable, dhcpv6: enable
  managed flag: true, address: 0:0:0:0:0:0:0:0
Config parameters:
  Accept-RA                   : Enabled
  Rappid Commit               : Enabled
  default_route_metric        : 10
  Preference                  : high
Server Info:
  Client mac | Server mac     : 64:7c:e8:8a:79:10 | 02:00:00:01:01:01
  Hostname                    :
  Server DUID                 : 00010001262c4077005056b18ad7 (length: 14)
  DHCP6 Server IP             : fe80:0:0:0:0:ff:fe01:101
  Lease value | Lease used    : 3600 | 1089
  Lease until | Current epoch : 65f440cc | 65f436fd
  DHCP6 state                 : BOUND
Retransmission parameters:
  Retry timer not running
Timer values of IAs (minimum) calculated:
  T1 | T2 | PT | VT           : 1800 | 2880 | 3600 | 3600
  Lease timer (valid lt)      : value: 3600, elapsed: 1089, remaining: 2511
  T1 timer (renew)            : value: 1800, elapsed: 1089, remaining: 711
  T2 timer (rebind)           : value: 2880, elapsed: 1089, remaining: 1791
IA_NA:
  IA Addr                     : 2a00:6020:1000:40:0:0:0:436
  IAID | T1 | T2 | PT | VT    : 03010010 | 1800 | 2880 | 3600 | 3600
IA_PD:
  IA Prefix                   : 2a00:6020:5004:2600:0:0:0:0/56
  IAID | T1 | T2 | PT | VT    : 19010010 | 1800 | 2880 | 3600 | 3600
Other Info:
  DNS List                    : Enabled (Server)
  DNS List, count             : 2 (list ptr: 0x0x7f986008a8d0)
    0                         : 2a00:6020:100:0:0:0:0:1 (lifetime: 0)
    1                         : 2a00:6020:200:0:0:0:0:1 (lifetime: 0)
  Suffix List                 : Enabled (Server)
  Suffix List, count          : 0 (list ptr: 0x(nil))
------------------------------------------


weberjoh@pa>

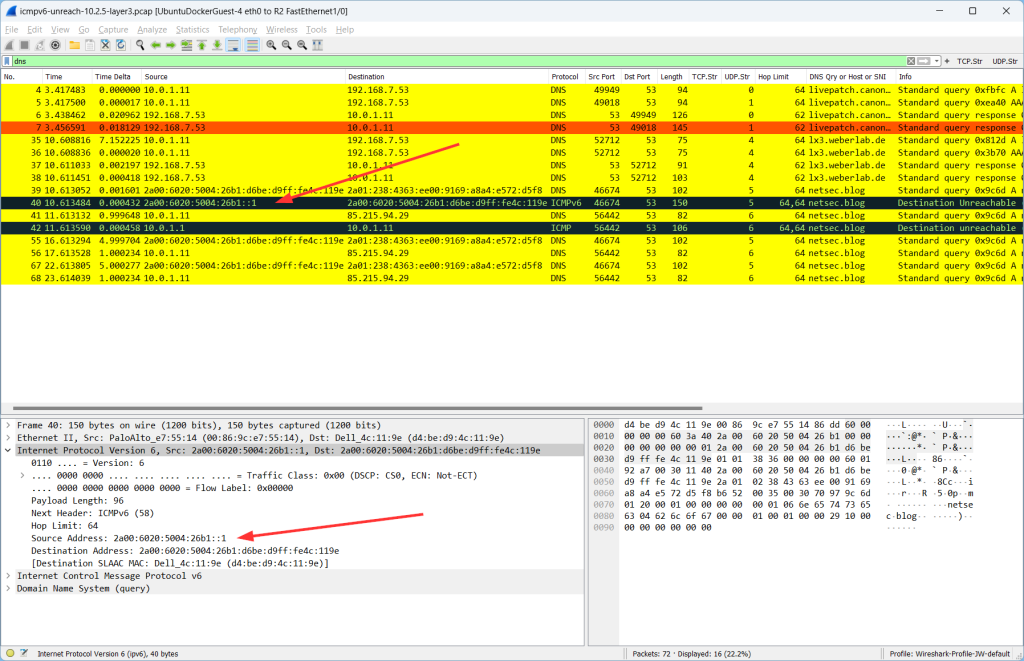
A Client’s Perspective

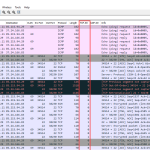
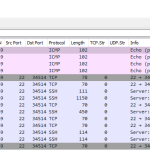
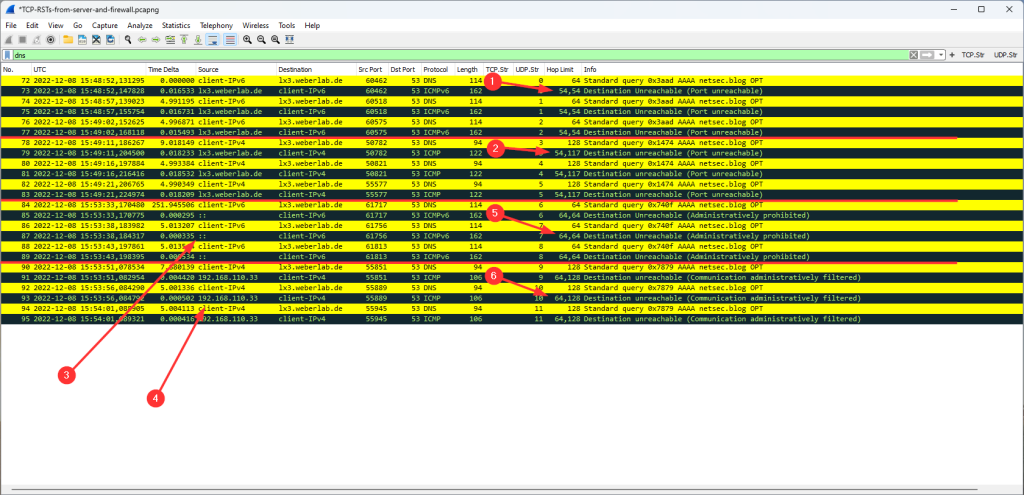
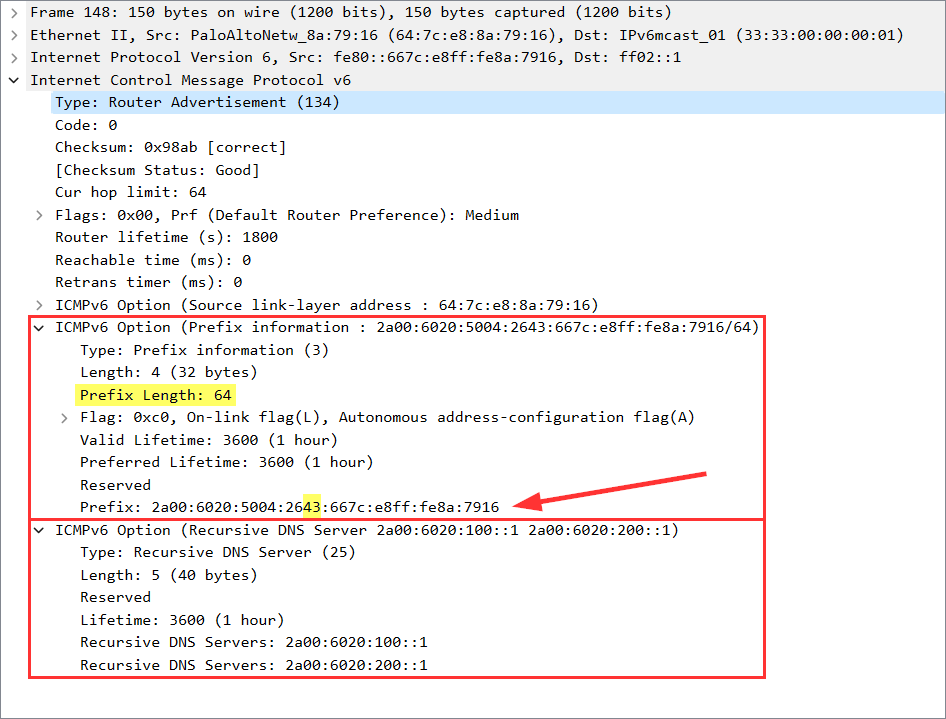
Following is a Wireshark screenshot from a router advertisement (RA, ICMPv6 message type 134) as seen by a client behind interface ethernet1/7. You can see the prefix with the correct subnet-ID of 43 within the “ICMPv6 Option: Prefix information”, as well as 2x the “Recursive DNS Server” which are the ones from my ISP gathered via DHCPv6:

However, note that the “Prefix” shows the full IPv6 address of the PANW interface rather than the first 64 bits only (with all other bits set to zero) which violates the standards (RFC 4861 “Neighbor Discovery for IP version 6 (IPv6)”, section 4.6.2):

The bits in the prefix after the prefix length are reserved and MUST be initialized to zero by the sender and ignored by the receiver.

What’s still missing?

With PAN-OS 11.1, Palo Alto Networks has added another IPv6 feature: IPv6 support for PPPoE. This was still missing in PAN-OS 11.0. With this feature, you can now operate a PAN-OS firewall directly on the WAN connection of residential ISPs. (I reported those missing features back then in 2015. 😂)

So, are we feature complete now? Unfortunately not. We are still missing a DHCPv6 server on PAN-OS. And, please, not only for IA_NA (Identity Association for Non-temporary Addresses) but also for IA_PD (Identity Association for delegated prefixes) as well! That is: DHCPv6-PD server-side. Yay.

And, we are missing DNS64 as well. This could easily be done within the DNS proxy. It would round up the IPv6 completeness of PAN-OS firewalls since all the other features such as RA with RDNSS/DNSSL and NAT64 are already there.

(A little fun fact at the end: The late Juniper ScreenOS firewalls had a working DHCPv6-PD implementation a decade ago! I blogged about it here in 2015, for example.)

Soli Deo Gloria!

Photo by Jamie Templeton on Unsplash.

How to install Palo Alto’s PAN-OS on a FortiGate

$
0
0

It happens occasionally that a customer has to choose between a Palo and a Forti. While I would always favour the Palo for good reasons, I can understand that the Forti is chosen for cost savings, for example.

Fortunately, there is a hidden way of installing PAN-OS, the operating system from Palo Alto Networks, on FortiGate hardware firewalls. Here’s how you can do it:

I’m using a Fortinet FortiGate FG-501E for this demo with (formerly) FortiOS v7.2.7. I’m upgrading it to PAN-OS 11.1.1.

As always: Please save a backup of your current FortiGate configuration. During this upgrade process, the firewall will reboot and lose all of its configuration. It will start as a factory-resetted Palo Alto firewall.

The main step is to upload and reboot the FortiGate into an alternative image, that is: a PAN-OS image. For generic FortiGates, you must choose the KVM-based PAN-OS images. With the following CLI command on the FortiGate, you can download the image from an TFTP server and reboot into it:

execute restore image tftp PA-VM-KVM-11.1.1.qcow2 192.168.21.5

The whole process in my lab was as follows. Note that you have to acknowledge the upgrade to an “unsupported image”:

fg2 # execute restore image tftp PA-VM-KVM-11.1.1.qcow2 192.168.21.5
This operation will replace the current firmware version!
Do you want to continue? (y/n)y

Please wait... 

Connect to tftp server 192.168.21.5 ... 
##########################################################

Get image from tftp server OK.
Warning: Upgrading to an unsupported image. Do you want to proceed? (y/n)y

Checking new firmware integrity ... pass

Please wait for system to restart.

After the reboot, you’re in the normal startup configuration of a Palo Alto firewall. –> Connect to it via the default IPv4 address of 192.168.1.1 with username:password of admin:admin.

In the dashboard, you can see the model and serial number, which are the ones from my FortiGate in this case:

Funnily enough, all those different interface names are used as well, that is:

In the end, you’ve got a fully featured PAN-OS-based firewall with all of its advantages on your FortiGate hardware. Have a nice day!

Photo by Lindsay Henwood on Unsplash.

Palo’s Mgmt-Intf is not usable with IPv6 anymore

$
0
0

Wow, that was unexpected: With PAN-OS 11.1 the out-of-band management interface of Palo Alto Networks firewalls doesn’t accept an IPv6 default route pointing to one of its own data interfaces anymore. That is: In most setups, you can’t use IPv6 for management purposes anymore. “Works as expected.” Wow. Really?

Setup

This is how we normally connect the management interface to one of the internal layer 3 interfaces/VLANs from the firewall itself (at least in small environments where the out-of-band management is not within its own dedicated infrastructure):

The default gateway for the management interface points to one of the IP addresses of a data interface of the same firewall. In my lab, the management interface settings look as follows:

Error

I upgraded a PA-440 from PAN-OS 11.0.3 to 11.1.1. After the reboot, the auto-commit was not able to succeed. It ended in an auto-commit loop. I did a “commit force” from the CLI which showed the following error:

In virtual-router default: Mgmt IPv6 GW 2a00:6020:5004:2621:0:0:0:1/128 is conflict with address 2a00:6020:5004:2621:0:0:0:1/64 on interface ethernet1/3.21.(Module: routed)
client routed phase 1 failure
Commit failed

After I changed the default gateway of the mgmt-interface (IPv6) to an unused IPv6 address, the commit succeeded. However, when changing it back to the correct default gateway (which is a layer 3 subinterface from the same firewall itself), the same error appears again.

Some notes:

  • I am using a logical router (not a virtual router). Hence I’m confused about this error since it reads “In virtual-router default: …”
  • This configuration was fully valid and running with PAN-OS 11.0.3 and previous versions for the last decade!
  • The IPv6 default gateway from the mgmt interface is the IPv6 global unicast address from ethernet1.3/21. Same for IPv4 where it’s still working.
  • I also tried to change the IPv6 default gateway address to the link-local address of ethernet1.3/21, which resulted in the same error.

Reply from PANW

Of course, I opened a support ticket with Palo Alto Networks. It turned out that this behaviour is already known and working as expected starting with PAN-OS 11.1. WHAT?

Root Cause:
============
Kernel doesn’t allow local IPv6 address as Gateway. So when we try add one of the DP interface IPv6 address as management interface IPv6 gateway, it throws an error “Error: Gateway can not be a local address.” So we shouldn’t support something that is not supported by the kernel. Hence decided to prevent user to configure the DP interface as management default gateway.

Fix:
===========
– This is functioning as designed from the PAN-OS version 11.1.0.

I also requested and got the bug ID, but since it is internal only, I won’t publish it here.

At least the engineering team was instructed to write documentation about this. Hahaha.

Some Notes

  • Isn’t it a real “out-of-band management” since the very beginning? If it were a real separate management plane, this would not happen, because the management and data plane would be *separate*. Hence it’s not the case. Ups.
  • To my mind, this setup (routing the management traffic through the firewall itself) is quite common if not the de facto standard. Why is Palo Alto Networks refusing this setup?
  • Isn’t Palo Alto Networks testing PAN-OS upgrades before releasing them enough? I would have expected this error to be noticed. I’m talking about the upgrade from PAN-OS 11.0 to 11.1. Either through a pre-check (before installing the upgrade) or at least through release notes.
  • Though Palo Alto Networks was a little behind concerning IPv6 completeness for the last years (e.g., DHCPv6-PD was introduced with PAN-OS 11.0 while other vendors had it for a couple of years), the quality of their implementation was always very good. But now they have introduced a big deal when it comes to IPv6. Bugs like this are not helping while deploying IPv6 at the customers’ sites.
  • Why is it still working with legacy IP? That is: Which “kernel” upgrade brought them to this error?
  • As workarounds, you must use “Interface Mgmt” profiles to access the firewall via HTTPS/SSH/SNMP/API on data interfaces rather than on the management interface.
  • Furthermore, you must rely on legacy IP for all other services such as DNS, NTP, syslog, authentication servers, etc. <– That’s exactly what was IPv6-only in my lab. D’oh!

Just as an example, this is how my NTP went dead (status: error, reachable: no):

weberjoh@pa> show ntp

NTP state:
    NTP not synched, using local clock
    NTP server: 2001:470:1f0b:16b0::dcfb:123
        status: error
        reachable: no
        authentication-type: none
    NTP server: 2a00:6020:5004:2600:85da:7fd8:1a80:8c8c
        status: error
        reachable: no
        authentication-type: none

Too bad.

R.I.P. IPv6-only at Palo Alto Networks firewalls. 😢

Soli Deo Gloria!

Photo by Jussara Paulo on Unsplash.

Viewing all 88 articles
Browse latest View live


<script src="https://jsc.adskeeper.com/r/s/rssing.com.1596347.js" async> </script>